 заплесневелый
Results and Discussion
1 Changes of content
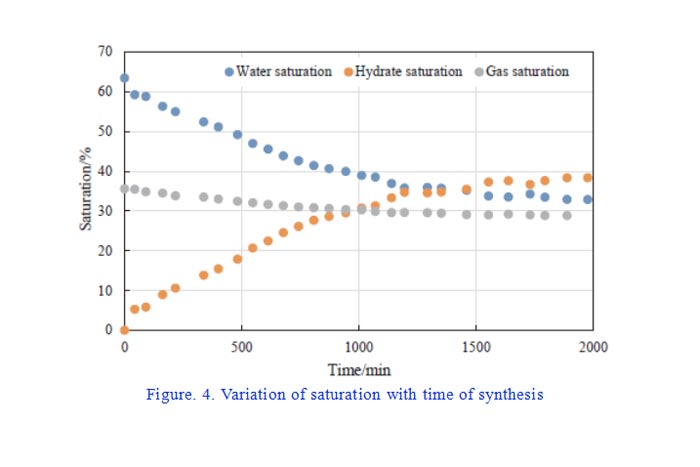
Фигура 4 shows the changes of water saturation, methane gas saturation and hydrate saturation with time during the hydrate formation process calculated by NMR T2 спектр. В этой статье, the excess gas method is adopted to ensure that the supply of methane gas is sufficient during the formation of hydrate, so the reduction of liquid water corresponds to the formation of solid hydrate.
It can be seen from the Figure that the formation rate of hydrate is fast at the initial stage and gradually flattens out with time. At the end of the synthesis, the saturation of water, methane and hydrate in the sample is 33%, 29% и 38% соответственно. Previous studies have confirmed that hydrate synthesis occurs only when the initial water saturation of the core is high. The experimental results also verify that hydrate synthesis stops when the saturation of liquid water is lower than 30%~40%.Therefore, the production of hydrate is not only controlled by temperature and pressure conditions, but also by liquid content.
2 MRI results of hydrate formation process
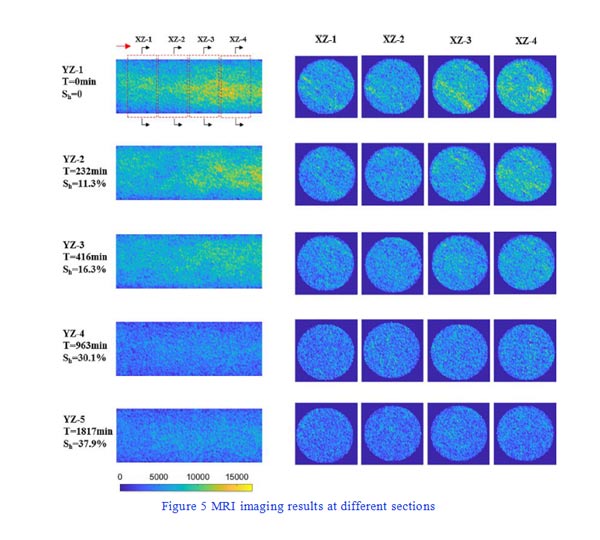
MRI imaging results of hydrate formation process Figure. 5 shows the nuclear magnetic imaging results of hydrate formation process. The Y-axis is the core length direction, and the slices in the XZ plane are round. The stronger the signal (yellow), the more liquid water there is. The results show that the water distribution in the core is heterogeneous after methane injection, with more gas and less water at the inlet. As the water amount of hydrate formation gradually decreases, the water distribution in the core is more uniform than the initial state when the hydrate formation is complete.
Фигура. 6 further shows the intensity distribution of nuclear magnetic signal along the Y-axis. With the formation of hydrate, the signal amplitude decreases both in terms of absolute amplitude and fluctuation amplitude. The signal amplitude obtained after 1800 min reflects the relatively uniform confined water state in the core, which is very consistent with the MRI results.
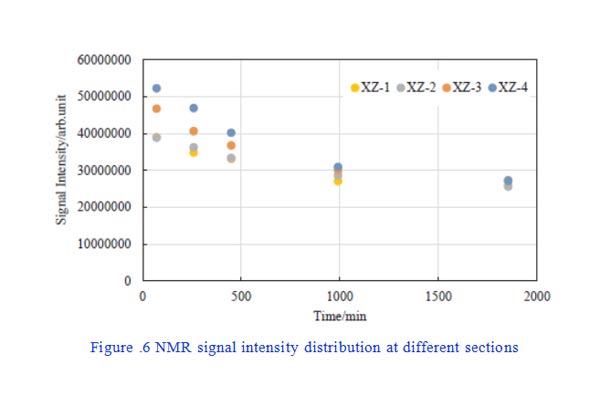
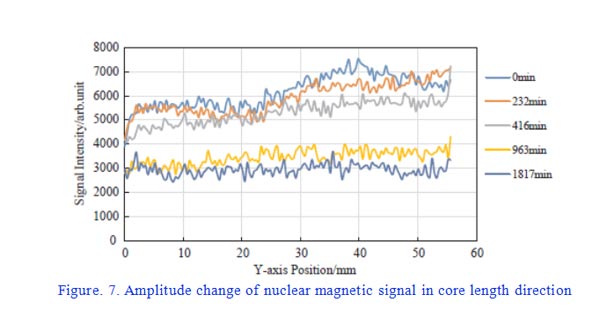
Фигура. 6 NMR signal intensity distribution diagram at different sections 7 further shows the signal amplitude variation from core inlet (z-1) to outlet (z-4).It can be seen that compared with the section at the inlet, the water near the outlet decreases more significantly, and after the hydrate is completely formed, the water saturation in each section is almost equal.
3 Т2 distribution of hydrate formation process
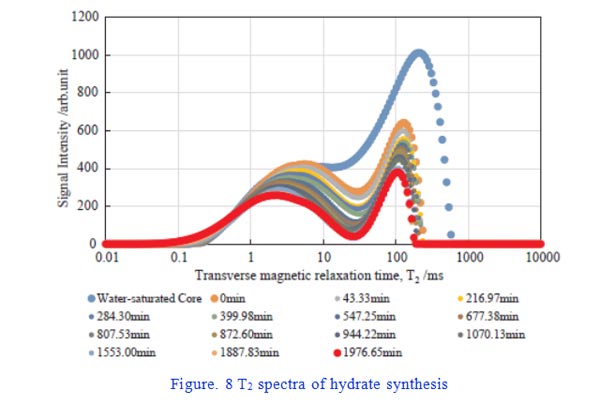
In Figure 8, the highest blue line is the NMR spectrum of saturated water, the orange line is the NMR spectrum of hydrate formation at the beginning after methane injection, and the red line is the complete NMR spectrum of hydrate formation. Comparing the blue and orange lines, it was found that the water in the macro pore (Т2>9РС) significantly decreased after methane injection, while the water in the macro pore (Т2<9РС) did not change, indicating that the gas did not enter the pores when methane was injected.
Однако, by comparing the orange and red lines, it was found that in the process of hydrate formation, the average amount of water in the big hole and the small hole decreased, то есть, the hydrate formed in the big hole and the small hole at the same time. This is because methane gas molecules can enter the pores through dissolution and diffusion, and react with the water in the pores to synthesize hydrate.
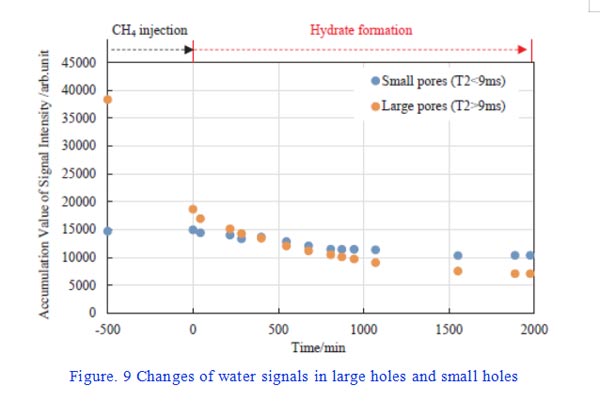
Фигура. 9 shows in more detail the formation of hydrates in large and small pores. By comparing the rate of change between blue and yellow spots, it was found that the rate of hydrate synthesis in large pores was faster. Однако, the rate of hydrate synthesis is slower than the large hole due to the slow methane gas supply rate.
4 Mechanism of hydrate synthesis in sandstone
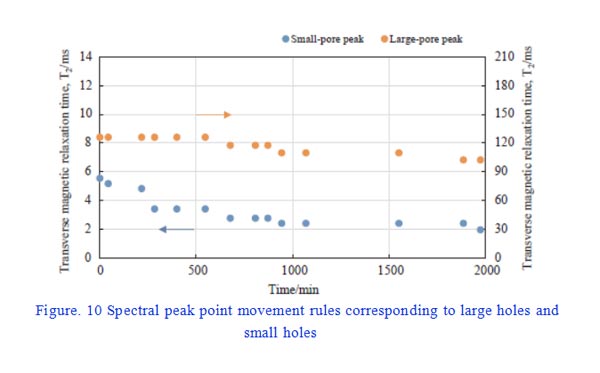
Фигура. 10 shows the movement rule of the peak points of the two peaks of the NMR spectrum in Figure 8 (corresponding to macro pore and keyhole respectively). It can be seen that the peak of the NMR spectrum moves to the left (smaller relaxation time) to some extent regardless of the macro pore or keyhole.
Sandstone surface relaxation rate is about an order of magnitude of hydrate surface relaxation, assuming the hydrate formation and pore wall, as its synthesis, sandstone surface is covered by hydrate, the relaxation rate is significantly reduced, according to the principle of the experimental formula of T2 values should be bigger, or move to the right, with the observations of T2 spectrum to the opposite, so not speculate that the hydrate formed in the pore surface, but the formation and the central of pore.
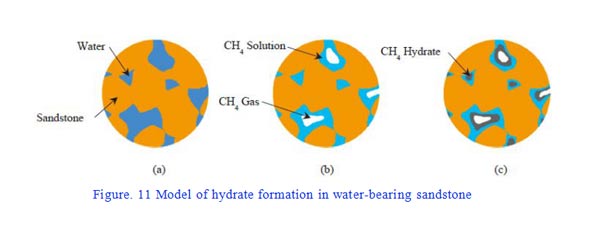
Фигура. 11 is a schematic diagram of methane hydrate synthesis in water-bearing sandstone by excess gas method. When methane molecules are injected into the core, they first exist in the macro pores, and then enter into the pores through dissolution and diffusion. Окончательно, hydrate synthesis occurs in the central part of pores in both macro pores and pores.
5 Expectation
В последние годы, the indoor synthesis experiment of hydrate is very popular and a direction of great investment. The key lies in how to accurately detect the amount and distribution of hydrate formation, which happens to be the strength of low field nuclear magnetism. Однако, in the study of methane hydrate, methane and water have hydrogen signal, and the change of temperature and pressure not only has a significant impact on the synthesis of methane hydrate, but also affects the detection of nuclear magnetic signal. Поэтому, in the future, more manpower and resources should be put into this field to continuously overcome difficulties.