Comparison of nitrogen adsorption and nuclear magnetic field test results
FIG. 2 shows the hysteresis of the adsorption and desorption isotherm of all six coal samples. No upper adsorption limit is observed under the relative high pressure. The pore diameter distribution obtained by low temperature nitrogen adsorption method was calculated by DFT model.
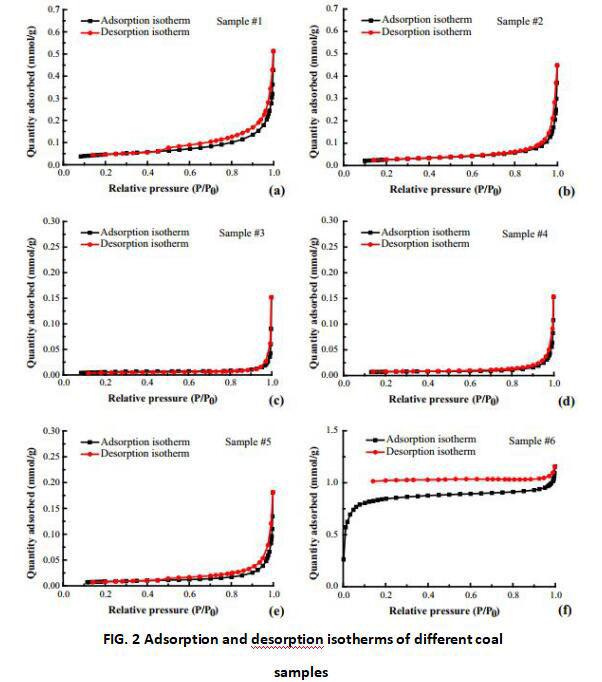
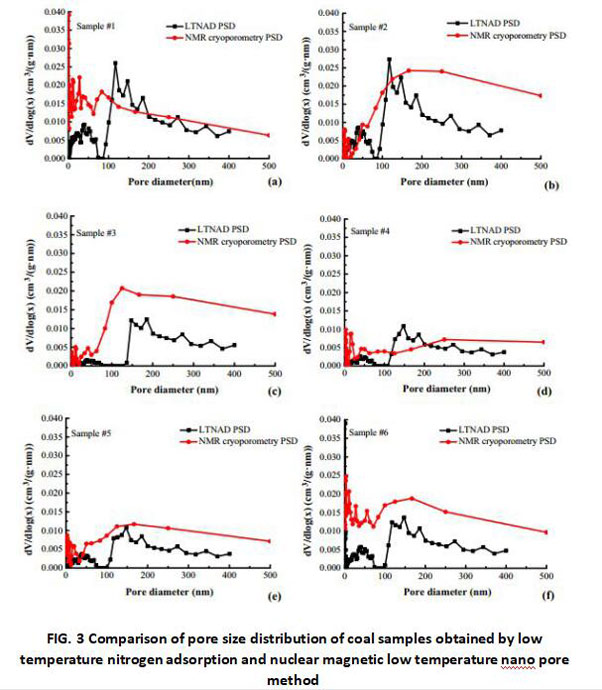
Figure 3 shows the pore size distribution of coal samples obtained by nuclear magnetic low temperature nano pore method and low temperature nitrogen adsorption method.
In terms of low-temperature nitrogen adsorption, the pore diameter of each sample ranged from 2-400nm, including mesoporous and macroporous pores. Each sample presented a bimodal pattern, with two peaks concentrated at 40nm and 147nm.The pore volume increased sharply in the range of 100-150nm, indicating that the resolution of the pore diameter distribution calculated by DFT method is limited, but this limitation will not affect the calculation of the total pore volume.
In terms of nuclear magnetic nanometer pore analysis, the pore diameter of the sample ranges from 2 nm to 500nm.The pore diameter distribution fluctuates sharply in the range < 50nm and has a large peak in the range of 100-250nm.
The pore size distribution obtained by nuclear magnetic low temperature nanometer pore size method is similar to that obtained by nitrogen adsorption at low temperature. The curves of all samples measured by these two methods are in good agreement. Compared with the low temperature nitrogen adsorption method, the nuclear magnetic low temperature nano pore method has a relatively higher pore volume in the mesoporous and large pore range. The pore volume of some samples adsorbed by nitrogen at low temperature in the range of 100-200nm was higher than that obtained by nuclear magnetic nanometer pore method. Compared with low-temperature nitrogen adsorption, the nuclear-magnetic low-temperature nanometer pore method is more sensitive to the pore diameter distribution curve within the range < 50nm, so the nuclear-magnetic low-temperature nanometer pore method can better reflect the change of pore diameter distribution within the range < 50nm.
Pore ratio volume ratio analysis
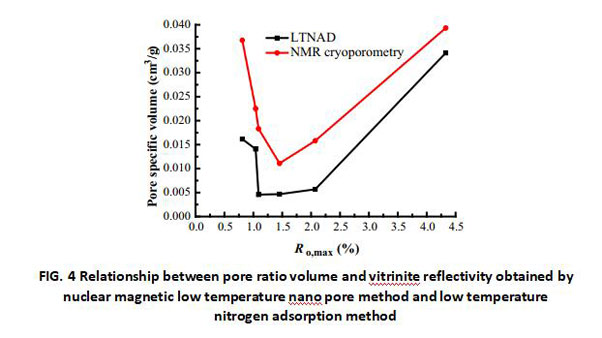
Figure 4 shows the relationship between pore ratio volume obtained by nuclear magnetic low temperature nano pore method and low temperature nitrogen adsorption method and vitrinite reflectivity (Ro, Max).It can be found that they have the same morphology, and the pore ratio volume obtained by nuclear magnetic low temperature nano pore method is always higher than that obtained by low temperature nitrogen adsorption method. The pore ratio volume varies with vitrinite reflectivity, and the pore ratio volume of medium coal is the lowest.
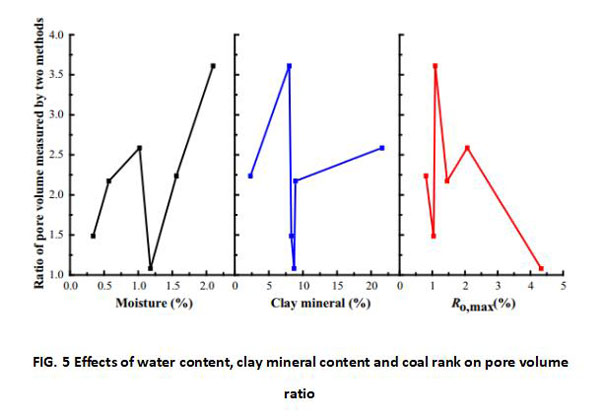
In order to quantitatively compare the difference in test results between the nuclear magnetic low temperature nano pore method and the low temperature nitrogen adsorption method, the ratio of the nuclear magnetic pore ratio volume to the nitrogen adsorption pore ratio volume within the range of less than 400nm was defined. The relationship between water content, clay mineral content, coal rank and pore volume ratio is shown in figure 5.The pore ratio volume ratio changed from 1.08 to 3.61, with an average of 2.2.
This ratio is not related to the vitrinite reflectance, but when the vitrinite reflectance is 4.329%, the ratio is close to 1, indicating that the pore volume measured by nuclear magnetic low temperature nano pore method and low temperature nitrogen adsorption method is very similar to that of anthracite.
Pore ratio volume ratio fluctuated with water content, and the overall increase trend was observed except for samples 1#(water content 1.56%) and 6#(water content 1.18%).The pore diameter of coal sample increases when it meets water, and the experiment of nuclear magnetic method is exactly water-saturated. The water expansion effect of coal sample is the reason that the pore volume measured by nuclear magnetic low temperature nano pore method is larger than that measured by low temperature nitrogen method.
The water-sensitive characteristics of clay minerals also affect the test results of NMR. Pore ratio volume ratio was not correlated with clay mineral content, because the clay mineral content in all samples was small and basically negligible. However, in other rocks rich in rock and soil minerals, the influence of clay minerals on the nuclear magnetic freeze-thaw method cannot be ignored.
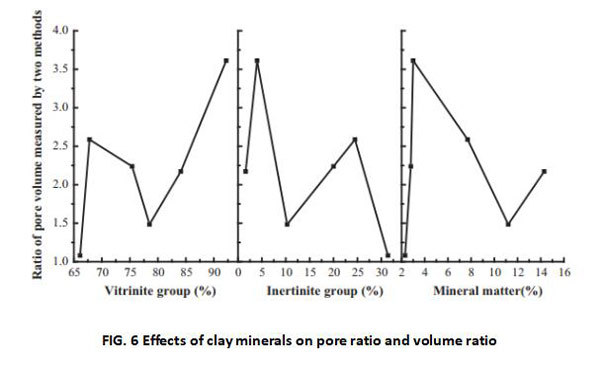
FIG. 6 shows the relationship between macerals and pore ratio. As can be seen from the figure, there is no significant relationship between macerals and pore ratio volume ratio.
Advantages of nuclear magnetic nanometer pore method at low temperature
Low-temperature nitrogen adsorption method calculates pore volume through different models. Each model has its own application conditions, for example, BJH model and DH model are only applicable to mesoporous but not microporous, HK model is only applicable to slit holes, SF model is only applicable to elliptical holes, etc. For mercury injection, excessive intrusion pressure can destroy the original pore structure.
According to the linear relationship between pore volume and signal strength and melting point and pore diameter, the nuclear magnetic low temperature nanometer pore size method can obtain pore size distribution without being affected by pore shape and pore size range.The nuclear magnetic low temperature nano pore method has a wider application range and no model selection error.
Conclusion
In this paper, nuclear magnetic low temperature nano pore method and low temperature nitrogen adsorption method were used to characterize the pore structure of coal of different coal rank, and the test results of the two methods were compared, and it was found that:
(1) Nuclear magnetic low temperature nano pore method can directly obtain pore size distribution through the linear relationship between pore volume and signal strength Spin finish NMR, which is not available in conventional nuclear magnetic relaxation method. The test results are not affected by pore shape and aperture range, which are not available in mercury injection and gas adsorption.
(2) The nuclear pore size distribution of nanometer pore method at low temperature and low temperature nitrogen adsorption method of pore size distribution has the very good similarity, but nuclear magnetic nanometer pore method at low temperature test results are usually higher than that of low temperature nitrogen adsorption test results, this may be related to low temperature nitrogen adsorption drying pretreatment process water in the pore and nuclear magnetic method for probe the expansion effect of fluid.
 NIUMAG