 NIUMAG
Shale nuclear magnetic resonance T2 spectrum distribution
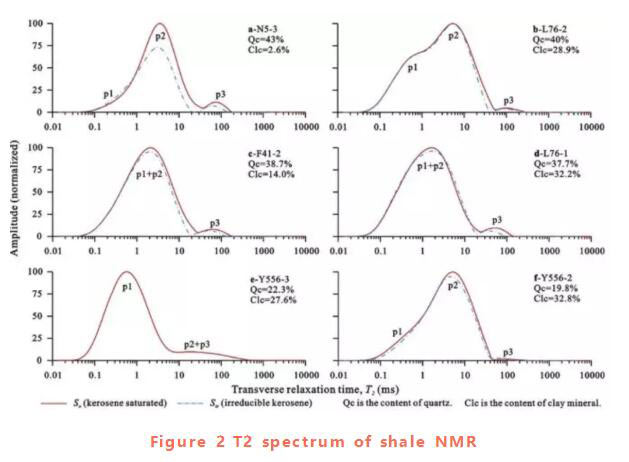
The T2 spectrum of the core under saturated oil conditions is shown in Figure 2. The T2 spectrum of the shale has three peaks: P1 peak (0.03-1ms), P2 peak (1-20ms), and P3 peak (20-300ms). However, the difference between the three peaks in some samples is not obvious, such as samples F41-2, L76-1, N5-3, and Y556-3.
The distribution of T2 spectrum under saturated oil conditions is related to shale mineral composition and diagenesis. According to the peak morphology, the shale T2 spectrum can be divided into three types: Type I has low quartz content, few dissolved pores, and contains sample Y556-3. Type I had a clear P1 peak at T2 value of 0.6 ms, but the P2 + P3 peak was smaller. Type II quartz has a moderate content (<40%), contains two samples (F41-2 and L76-1), and has a large P1 + P2 peak and a small P3 peak at a T2 value of 2ms. Type III quartz has a large content (> 40%), has obvious P2 peaks and small amplitude P1 and P3 peaks, and contains three samples (N5-3, L76-2 and Y556-2).
The T2 spectrum of shale oil-saturated state depends on the quartz content and the number of dissolved pores. The shale P3 peak is smaller and the P2 peak (or P1 + P2 peak) is larger, rock Core analyser indicating that the shale has fewer large pores and more small pores.
The T2 spectrum of the core in the state of residual oil is shown by the dashed line in Figure 2 (Y556-3 is destroyed during centrifugation). The T2 spectrum of the remaining 5 samples under the condition of residual oil is generally lower than the T2 spectrum of the saturated oil: the P1 peak has a small difference between saturated and residual oil conditions, and the residual P2 peak is lower than the saturated oil P2 peak, and the residual oil The P3 peak moves in the direction of decreasing T2. However, the T2 value of some shale residual oil is higher than the T2 value of saturated oil, which may be caused by the complexity of pore morphology, because the fluid in the center of the pore will be discharged and the fluid at the edge of the pore will be retained during the complex pore centrifugation.
Porosity and mobile fluid distribution
The amplitude of the T2 spectrum is directly proportional to the number of hydrogen atoms and corresponds to the pore volume in the sample. In the characterization of oil-bearing reservoirs, nuclear magnetic porosity is usually calculated by a model based on the T2 spectral amplitude, which uses standard samples to calculate the statistical relationship between the fluid volume and the T2 spectral amplitude. However, the T2 of kerosene in bulk is long and cannot be fully detected, resulting in incomplete acquisition of nuclear magnetic signals. Therefore, in this study, the initial amplitude of the spin echo was used to calculate the nuclear magnetic porosity of the saturated kerosene shale. The nuclear magnetic porosity is in good agreement with the helium porosity (see Table 2).
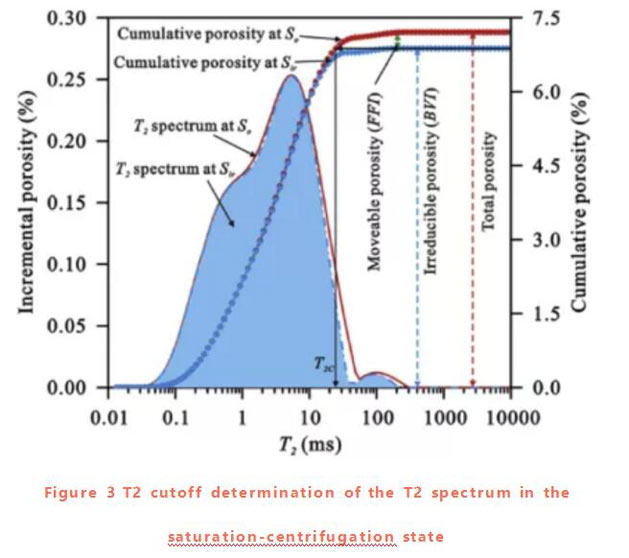
In NMR, the mobile fluid distribution can be obtained through the joint measurement of core saturation and centrifugal state. Residual and saturated fluids are usually estimated by the T2 cutoff. The T2 cutoff value is the T2 relaxation time threshold. The T2 spectrum can be divided into two parts: the part smaller than the T2 cutoff value corresponds to the residual fluid, and the part larger than the T2 cutoff value corresponds to the movable fluid. The T2 cut-off value can be determined from the cumulative porosity curve under saturated and centrifuged conditions (Figure 3). However, it can be seen from Fig. 3 that part of the fluid larger than the T2 cut-off value still does not come out, and part of the fluid smaller than the T2 cut-off value still has part of the fluid, because the pore throat structure of shale is more complicated.
This paper compares the cumulative porosity under saturated / residual oil conditions to determine shale mobile and residual fluid porosity. The movable porosity value is low, ranging from 0.07% to 1.24%, with an average value of 0.58%. The mobile porosity does not correspond to the total porosity. Some samples have a higher total porosity but a lower mobile porosity. Movable porosity is mainly related to the development of pores in the shale. The more pores in the sample, the higher the mobile porosity (N5-3), while the medium and micropores have a low mobile porosity (L76- 1).
Permeability
Permeability is a key parameter for reservoir characterization and can be estimated from porosity and pore size distributions obtained by nuclear magnetic resonance. Common reservoir models include: Coates model and SDR model. This article compares these two classic models with a new one.
(1) Coates model
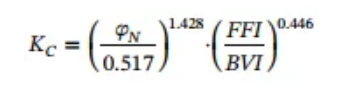
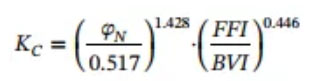
The model is based on the Timur-Coates formula:
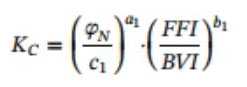
Taking the logarithms on both sides of the above formula, there are:
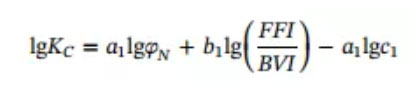
Based on multiple linear regression analysis, a1 is 1.428, b1 is 0.446, and c1 is 0.517. The formula of the Coates model for shale is as follows:
The permeability obtained by the Coates model is in good agreement with the permeability measured by helium.
(2) SDR model
The model is based on the following formula:
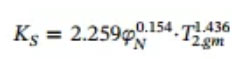
Take the logarithm on both sides of the above formula:
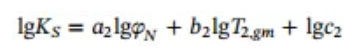
The multiple linear regression analysis method was used to obtain the values of a2, b2, and c2. The calculation formula of the shale SDR model is:
(3) New model
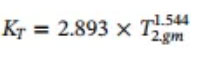
Both models consider permeability as a function of porosity. However, porosity is mainly affected by the pore structure and pore size distribution. The T2 spectral distribution can reflect the pore size distribution. The T2 geometric mean is used to estimate the permeability without porosity data. As shown in Table 2, there is a good correlation between the measured permeability of helium and the geometric mean of T2. The power exponential equation of the measured permeability of helium and the geometric mean of T2 is established as follows:
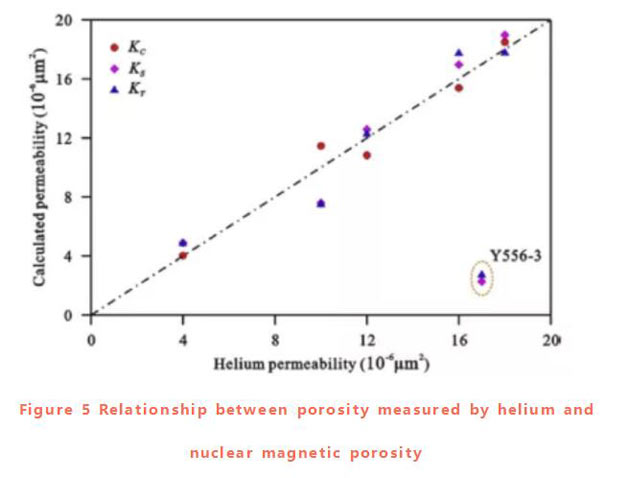
As shown in Figure 5, the estimated permeability of the three models is close to the measured permeability, indicating that all three models can be used to evaluate the magnetic permeability of shale samples. However, the model based on the T2 geometric mean is more convenient than other models.
T2 spectrum recognition
According to previous studies, pores are divided into three types: micropores (<100nm), mesopores (100-1000nm), and macropores (> 1000nm). Micro, medium and large pores were then divided into adsorption pores and percolation pores, respectively, according to the percolation threshold of 100 nm.
The T2 value can reflect the pore size, and a larger T2 value corresponds to a larger pore. Therefore, the pore size distribution of shale can be analyzed by the number, size and position of T2 peaks. As shown in Figure 2, multiple peaks in the T2 spectrum represent pores of various sizes; connectivity between peaks can reflect the connectivity of pores, and spectral peaks with better connectivity correspond to multiple pores with better connectivity.
The T2 spectrum of the core in the saturated oil state corresponds to all pores, and the T2 spectrum in the state of residual oil corresponds to adsorption pores and some seepage pores. The typical T2 spectrum can be divided into adsorption holes and seepage holes. The P1 peak corresponds to the adsorption hole, and the P2 and P3 peaks correspond to the percolation hole.
According to related studies, the three peaks of a typical T2 spectrum correspond to micropores, mesopores, and macropores, respectively. Shale contains a large number of mesopores, more micropores and a few macropores. In addition, the mesopores and macropores have good connectivity, which is important for fluid permeability and mobility; micropores are not good for fluid flow due to capillary pressure.