 NIUMAG
Comparison of MRI, CT and SEM
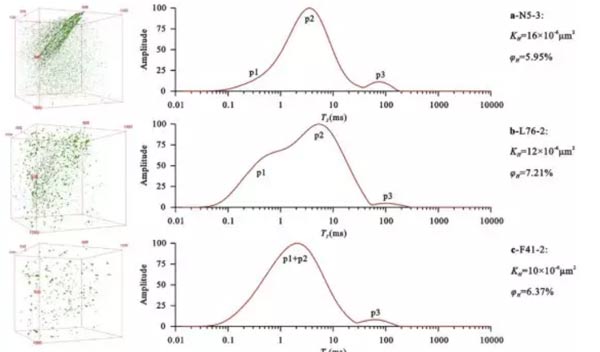
The shale nuclear magnetic pore size distribution is in good agreement with the helium porosity, permeability and CT analysis results.
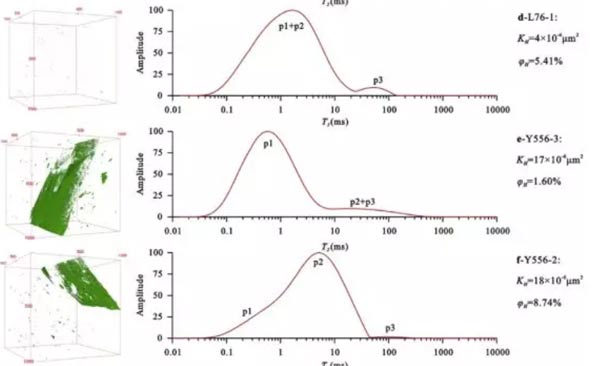
See Figure 6. Sample N5-3 has mesopores, with fewer large pores corresponding to medium porosity, and cracks corresponding to higher permeability. Samples L76-2 and F41-2 had medium micropores and mesopores with few large pores, which corresponded to high porosity. CT reconstruction found no cracks, so the permeability was medium. Sample L76-1 had few macropores and fissures, and micro, mesopores developed, corresponding to medium porosity and lowest permeability. Sample Y556-3 developed fissures but had a large number of micropores, corresponding to low porosity and high permeability. Sample Y556-2 can be seen from CT that it contains a small amount of large pores and fissures with high permeability. Shale porosity is mainly affected by mesopores, and permeability is mainly affected by macropores and fissures.
The shale pore structure (pore type, morphology, size, etc.) can be accurately characterized by high-resolution scanning electron microscopy. The shale pore size distribution obtained by the continuous pore size distribution method is compared with the NMR results, as shown in Figure 7. The T2 spectral pore size distribution is in good agreement with the scanning electron microscope pore size distribution.
Pore size distribution based on nuclear magnetic T2 spectrum
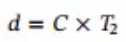
When the geometric shape factor is determined, the T2 calculation formula is as follows:
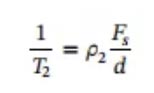
When the pore shape is columnar or spherical, Fs is 4 and 6. d is the pore diameter. When Fs and ρ2 are constant, then:
The pore size distribution of NMR T2 spectrum can be obtained by combining the pore size distribution of SEM image analysis. Because the C value in each sample is relatively close, sample L76-2 was selected to determine the C value.
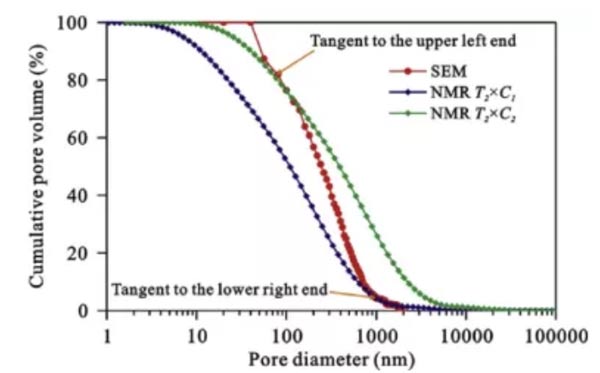
Combining the SEM pore size distribution to determine the NMR conversion coefficient C is divided into four steps:
(1) Obtain cumulative pore volume distribution curve from T2 spectrum and scanning electron microscope;
(2) The minimum C value (C1) is the tangent of the cumulative pore volume curve of the T2 spectrum and the lower right end of the cumulative pore volume curve of the scanning electron microscope;
(3) The maximum C value (C2) is the tangent of the cumulative pore volume curve of the T2 spectrum and the upper left end of the cumulative pore volume curve of the scanning electron microscope;
(4) The final C value is the average of C1 and C2.
The method is shown in Figure 8. The C value of the shale sample is 80. The final pore size distribution of the six shale samples is shown in Figure 9.
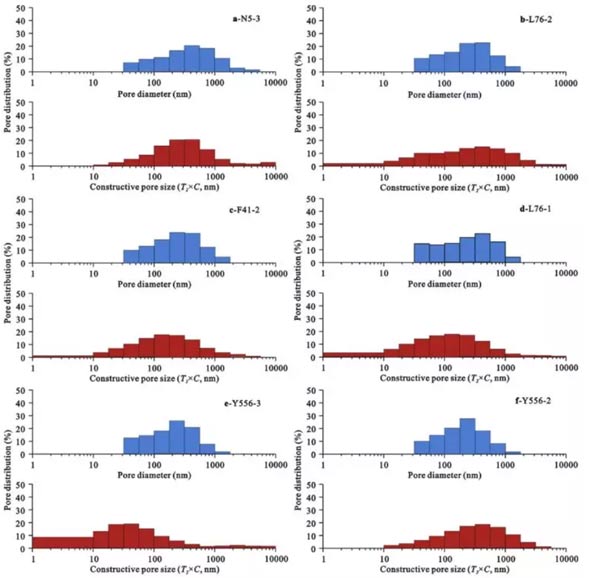
The NMR pore size distribution obtained by the above method is in good agreement with that of the scanning electron microscope. Scanning electron microscopy has fewer pores and micropores. This is because the resolution of scanning electron microscopy in this paper is 23.83 nm, which is smaller than this size. It can be seen that the scanning electron microscope method is limited by its resolution.
Conclusion
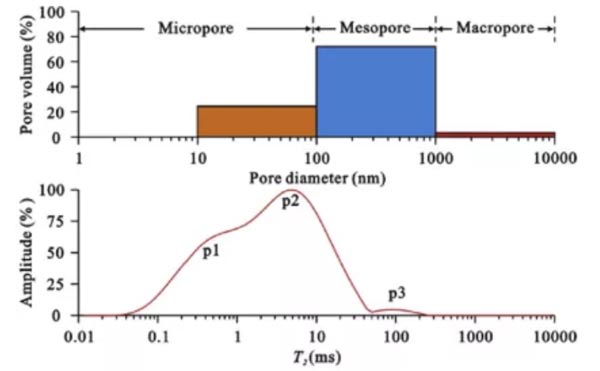
(1) The T2 spectrum of shale NMR is affected by the content of quartz and the number of dissolved holes. The T2 spectrum of shale under saturated kerosene is usually bimodal or multimodal, with micropores (<100nm) peaks at 0.03-1ms, mesopores (100-1000nm) peaks at 1-20ms, and macropores (> 1000nm). The peak is at> 20ms.
(2) Nuclear magnetic porosity can be calculated from the initial amplitude of the spin echo sequence under the condition of 100% saturated kerosene, and the porosity measured by the remaining helium has good consistency. By combining the T2 spectrum of centrifugation, it can be calculated that the shale’s movable porosity is between 0.07% and 1.24%, which mainly depends on the degree of mesopore development.
(3) The permeability obtained through the three permeability calculation models is consistent with the permeability measured by helium. The NMR Analyzer pore size distribution can be obtained by combining SEM image analysis to accurately represent the pore size of shale.