Abstract This review paper introduces 2DNMR pulse trains frequently used in core analysis and their applications, as well as relevant relaxation mechanisms. 2D NMR technique content of D-T2 sequence, T1-T2 sequence and 2D NMI technology which can be used to measure the property parameters of formation fluid and the physics parameters directly, such as diffusion coefficient, время отдыха, oil saturation, пористость, permeability and so on. The 2D NMR map can also be used to distinguish between oil, gas and water. Introduction Crude oil, water and gas from core are rich in hydrogen nuclei; one-dimensional NMR technique is to measure the T2 relaxation time. Most of time the oil and water T2 relaxation time will be overlap, it’s difficult to distinguish, restricted the NMR technology in core analysis. В последние годы, 2D NMR technology have developed rapidly.2D NMR testing give two dimensional information at once experiment, it give more information. This method opens a new area of core analysis. Using the two parameter (transverse relaxation time T2, longitudinal relaxation time T1, fluid diffusion coefficient D), it can distinguish between oil, gas and water easily. Methods and Principles 1. D-T2 Sequence

Fig.1 D-T2 Sequence Fig.2 D-T2 Sequence Sampling example The sampling signal M (т) of D-T2 sequence is

D -T2 sequence which is the CPMG sequence by adding two changes gradients. According to two-dimensional inversion, we can get T2 relaxation time and diffusion coefficient at the same time. D-T2 sequence can distinguish between oil, water and gas easily. At room temperature, water diffusion coefficient D is 2.5E-9m2/s, the oil diffusion coefficient is a distribution between 10E-8 m2/s to10E-11 m2/s, the gas is 1E-7 m2/s.
2. T1-T2 Sequence

Fig.3 T1-T2 Sequence
Fig.4 T1-T2 Sequence
The sampling signal Mis of T1-T2 sequence is

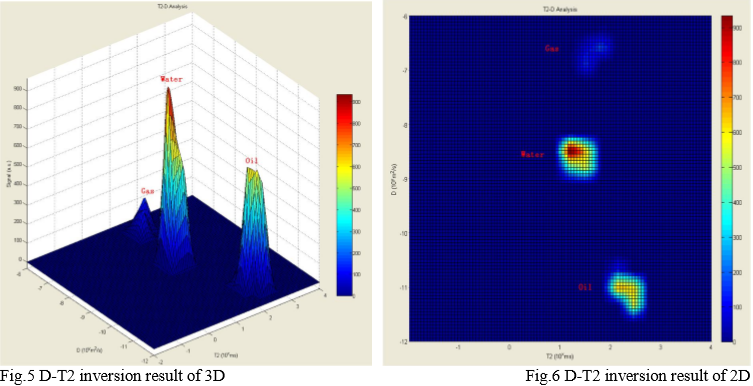
T1 -T2 sequence which is the CPMG sequence by adding 180 degree pulse before. Use the changes of interval time t1 from 180 degree pulse to90 degree pulse as shown in fig.3 to achieve another dimension of the T1 relaxation. T1-T2 sequence testing has particular advantage in gas identification. Studies have shown that even if the sampled signal to noise ratio of 20, but also a good distinction between bound water, movable water and gas. 3. Imaging Sequence MRI technology is not used to describe the core itself, but rather describe the cores of the fluid. The technology let intuitive understanding the location and size of fluid come true. Advantages is non-destructive and accurate; disadvantage is when the field is high the image will be distortion. So that, imaging by low-field is intuitive and accurate. Results and Analysis 1. D-T2 Sequence Simulated the core sample which content oil, water and gas. Gas saturation is 10%; oil saturation is 40%, water saturation is 50%. Gas diffusion coefficient is 1.5E-7 m2/s, oil diffusion coefficient is 1.0E-11 m2/s, и вода (bound water) diffusion coefficient is 2.5E-9 m2/s. T2 relaxation time of gas, oil and water is 40ms,200РС, 20РС, the sampling signal to noise ratio (ОСШ) is 30.
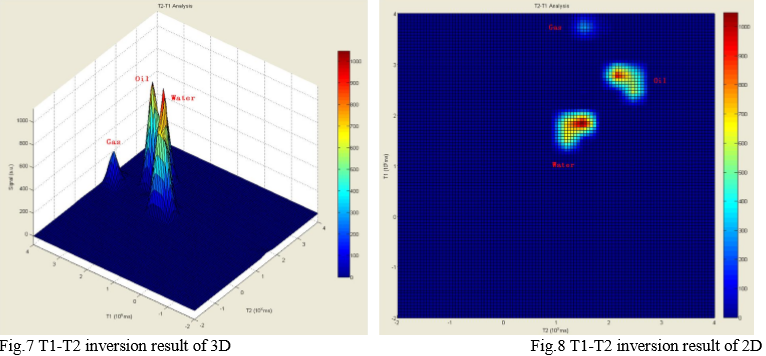
As shown in fig.5 and fig.6, we can distinguish between oil, water and gas easily using the different diffusion coefficients. Only one DT2 experiment can get all components ratio and relaxation time. 2. T1-T2 Sequence Simulated the core sample which content oil, water and gas. Gas saturation is 10%; oil saturation is 40%, water saturation is 50%. T2 relaxation time of gas, oil and water is 40ms,200РС, 20РС; T1 relaxation time of gas, oil and water is 3000ms,400РС, 40РС; SNR is 30.
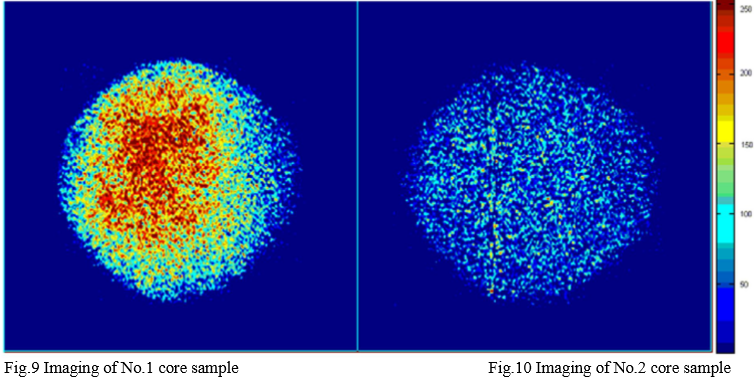
Fig.7 T1-T2 inversion result of 3D Fig.8 T1-T2 inversion result of 2D As shown in fig.7and fig.8, the longest T1 relaxation time is gas, and we can distinguish oil and water from T2 relaxation time. 3. Imaging Sequence Experimental samples: two full-diameter shell rock core; using multi-spin echo sequence, the parameter is TW=0.5s, TE=5ms, similar to T2 weighted images. The imaging thickness is same as sample thickness, phase encoding steps is 128.
Fig.9 Imaging of No.1 core sample Fig.10 Imaging of No.2 core sample As shown in fig.9 and fig.10, the bright circular image area is the sample; the blue surrounding area is background. The color is brighter, the fluid content is more. The colorful area is focus on the left center of No.1 sample, it shows that this area has more water and oil content and the porosity is larger. No.2 sample did not have high lighting area, it shows that this core may have internal cracks; at left side has a vertical distribution cracks and other position has a similar texture, this texture may be cracks or may be the framework among pores.
Заключение 1. Low-field 2D NMR technology can quickly and easily distinguish between the rock samples in the oil, water and gas. The method is more intuitive and visualize. 2. When the SNR is 30, DT2 sequence can distinguish between the oil, bound water and gas, and also can calculate the proportion of each component, T2 relaxation time and other rock physical parameters. 3. When the SNR is 30, T1T2 sequence can distinguish between the oil, bound water and gas, and also can calculate the proportion of each component, T1 and T2 relaxation time. 4. 2D NMI techniques can observe the porosity of core sample intuitive and visualize. Рекомендации 1. R.H. Xie L.Z. Xiao, .Вт. Lu. (Т2, Т1) Two-Dimensional NMR method for fluid typing, Well Logging Technology. 3(2009), 26. 2. З. B. Gu, W .Liu, T.Q. Sun. Application of 2D NMR Techniques in Petroleum Logging ,Chinese Journal of Magnetic Resonance. 26(2009), 560.
Abstract This review paper introduces 2DNMR pulse trains frequently used in core analysis and their applications, as well as relevant relaxation mechanisms. 2D NMR technique content of D-T2 sequence, T1-T2 sequence and 2D NMI technology which can be used to measure the property parameters of formation fluid and the physics parameters directly, such as diffusion coefficient, время отдыха, oil saturation, пористость, permeability and so on. The 2D NMR map can also be used to distinguish between oil, gas and water. Introduction Crude oil, water and gas from core are rich in hydrogen nuclei; one-dimensional NMR technique is to measure the T2 relaxation time. Most of time the oil and water T2 relaxation time will be overlap, it’s difficult to distinguish, restricted the NMR technology in core analysis. В последние годы, 2D NMR technology have developed rapidly.2D NMR testing give two dimensional information at once experiment, it give more information. This method opens a new area of core analysis. Using the two parameter (transverse relaxation time T2, longitudinal relaxation time T1, fluid diffusion coefficient D), it can distinguish between oil, gas and water easily. Methods and Principles 1. D-T2 Sequence
Fig.1 D-T2 Sequence Fig.2 D-T2 Sequence Sampling example The sampling signal M (т) of D-T2 sequence is M(т)=М(0)exp(−γGδ(∆−δ 3)Д)exp (−t T) D -T2 sequence which is the CPMG sequence by adding two changes gradients. According to two-dimensional inversion, we can get T2 relaxation time and diffusion coefficient at the same time. D-T2 sequence can distinguish between oil, water and gas easily. At room temperature, water diffusion coefficient D is 2.5E-9m2/s, the oil diffusion coefficient is a distribution between 10E-8 m2/s to10E-11 m2/s, the gas is 1E-7 m2/s.
2. T1-T2 Sequence
Fig.3 T1-T2 Sequence Fig.4 T1-T2 Sequence Sampling example The sampling signal Mis of T1-T2 sequence is Mis=f1−2∗exp−T, Texp−t T+ε T1 -T2 sequence which is the CPMG sequence by adding 180 degree pulse before. Use the changes of interval time t1 from 180 degree pulse to90 degree pulse as shown in fig.3 to achieve another dimension of the T1 relaxation. T1-T2 sequence testing has particular advantage in gas identification. Studies have shown that even if the sampled signal to noise ratio of 20, but also a good distinction between bound water, movable water and gas. 3. Imaging Sequence MRI technology is not used to describe the core itself, but rather describe the cores of the fluid. The technology let intuitive understanding the location and size of fluid come true. Advantages is non-destructive and accurate; disadvantage is when the field is high the image will be distortion. So that, imaging by low-field is intuitive and accurate. Results and Analysis 1. D-T2 Sequence Simulated the core sample which content oil, water and gas. Gas saturation is 10%; oil saturation is 40%, water saturation is 50%. Gas diffusion coefficient is 1.5E-7 m2/s, oil diffusion coefficient is 1.0E-11 m2/s, и вода (bound water) diffusion coefficient is 2.5E-9 m2/s. T2 relaxation time of gas, oil and water is 40ms,200РС, 20РС, the sampling signal to noise ratio (ОСШ) is 30.

As shown in fig.5 and fig.6, we can distinguish between oil, water and gas easily using the different diffusion coefficients. Only one DT2 experiment can get all components ratio and relaxation time. 2. T1-T2 Sequence Simulated the core sample which content oil, water and gas. Gas saturation is 10%; oil saturation is 40%, water saturation is 50%. T2 relaxation time of gas, oil and water is 40ms,200РС, 20РС; T1 relaxation time of gas, oil and water is 3000ms,400РС, 40РС; SNR is 30.

Fig.7 T1-T2 inversion result of 3D Fig.8 T1-T2 inversion result of 2D As shown in fig.7and fig.8, the longest T1 relaxation time is gas, and we can distinguish oil and water from T2 relaxation time. 3. Imaging Sequence Experimental samples: two full-diameter shell rock core; using multi-spin echo sequence, the parameter is TW=0.5s, TE=5ms, similar to T2 weighted images. The imaging thickness is same as sample thickness, phase encoding steps is 128.

Fig.9 Imaging of No.1 core sample Fig.10 Imaging of No.2 core sample As shown in fig.9 and fig.10, the bright circular image area is the sample; the blue surrounding area is background. The color is brighter, the fluid content is more. The colorful area is focus on the left center of No.1 sample, it shows that this area has more water and oil content and the porosity is larger. No.2 sample did not have high lighting area, it shows that this core may have internal cracks; at left side has a vertical distribution cracks and other position has a similar texture, this texture may be cracks or may be the framework among pores.
Заключение
1. Low-field 2D NMR technology can quickly and easily distinguish between the rock samples in the oil, water and gas. The method is more intuitive and visualize.
2. When the SNR is 30, DT2 sequence can distinguish between the oil, bound water and gas, and also can calculate the proportion of each component, T2 relaxation time and other rock physical parameters.
3. When the SNR is 30, T1T2 sequence can distinguish between the oil, bound water and gas, and also can calculate the proportion of each component, T1 and T2 relaxation time.
4. 2D NMI techniques can observe the porosity of core sample intuitive and visualize. Рекомендации 1. R.H. Xie L.Z. Xiao, .Вт. Lu. (Т2, Т1) Two-Dimensional NMR method for fluid typing, Well Logging Technology. 3(2009), 26. 2. З. B. Gu, W .Liu, T.Q. Sun. Application of 2D NMR Techniques in Petroleum Logging ,Chinese Journal of Magnetic Resonance. 26(2009), 560.
Q Caia, B. Y.L. Zhanga, п. Q. Yanga
NIUMAG ELECTRONIC TECHNOLOGY CO., LTD
 заплесневелый