NIUMAG
Expansion curves under different cycles
Figure 2 shows the soil sample expansion curve under 0-4 dry and wet cycles. NMR Analyzer Because the soil sample is laterally restricted by the ring knife, only vertical deformation occurs. The vertical expansion is the volume expansion of the soil sample. The volume expansion increases by about 20% after the first cycle, and then gradually decreases as the number of cycles increases. In the drying process, the radial shrinkage of the soil sample is greater than the axial shrinkage, which makes the soil sample height increase from the initial.
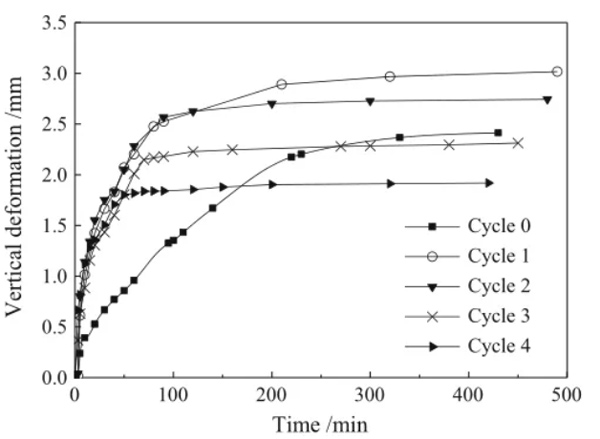
The change curve of the expansion curve under different cycle times is similar: first rapid growth, then slow growth, and finally stabilizes. At 0 cycles, the soil sample needs 230 minutes to reach 90% of the expansion deformation, while the 1-4 cycle soil sample only takes 100 minutes.
Considering the different expansion characteristics of soil samples in different time periods, taking 3 cycles as an example, the curve is divided into 3 sections according to 0-30min, 30-90min and> 90min, and each section is linearly fitted, as shown in Figure 3. The correlation coefficient of the piecewise fitting is higher, and the gradients of the three stages are smaller in turn.
NMR Result
T2 Cut-off value
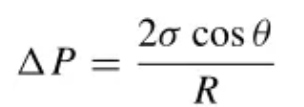
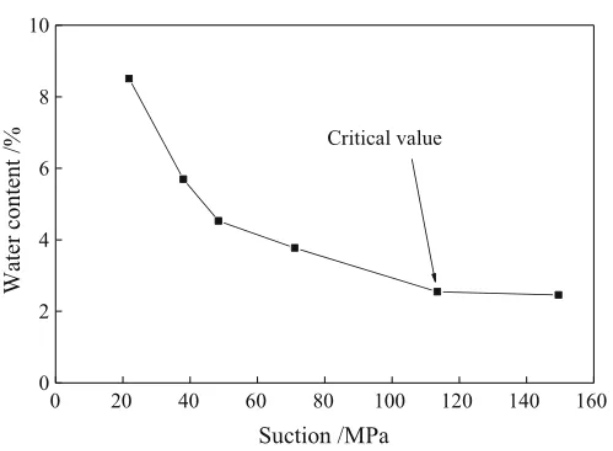
Figure 4 shows the change of soil moisture content under different suction. As the suction increases, the water content gradually decreases. According to the corresponding formula between the suction force and the pore diameter, the critical suction force is determined to be 113.5 MPa, corresponding to the pore diameter of 1.28 nm. The suction force exceeding 113.5MPa still cannot discharge the adsorbed water in the pore size of <1.28nm, and 1.28nm is also the critical value to distinguish macropores from micropores.
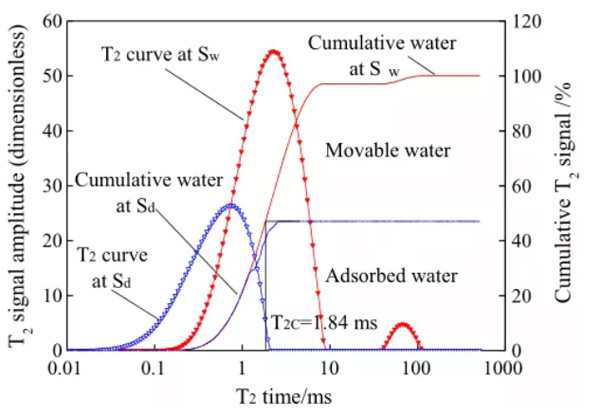
The T2 curve at saturation and 113.5MPa suction is shown in Figure 5. The saturation curve contains water in macropores and micropores, while the curve under critical suction only contains water in micropores. Determine the T2 cut-off value is 1.84ms, see Figure 5 for the determination method. From the calculation of T2 cut-off value, the proportion of large pores is 47.1% and that of small pores is 52.9%.
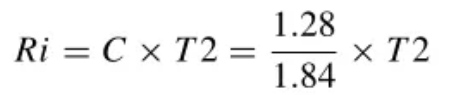
The conversion coefficient can be obtained through the critical aperture and the T2 cutoff value, and then the T2 distribution curve is converted into the aperture distribution curve:
T2 distribution curve under different water content
The T2 distribution curve of seven samples with water content ranging from 10-28% in this paper is shown in Figure 6. According to the method mentioned in 4.1, the T2 distribution curve has been converted into pore size distribution curve.
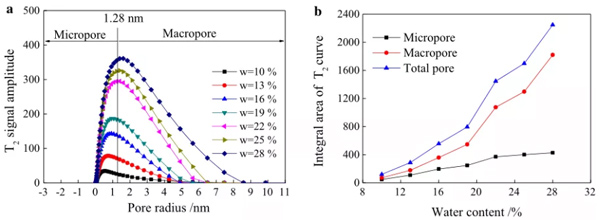
As shown in Fig. 6 (a), all pore size distribution curves are in the form of a single peak. Pore size distribution is uneven; most pores are distributed between 0.06-8.57nm and the number of macropores (1.28-8.57nm) is larger than micropores (0.06-1.28nm); the peak gradually expands to the right.
As shown in Fig. 6 (b), when the water content increases, the number of macropores and micropores both increase: when the water content is low, the two are close; when the water content is high, the macropores increase more significantly.
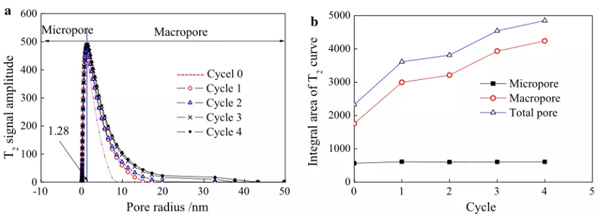
T2 distribution curve under different cycle times
The pore size distribution under different dry and wet cycles is shown in Figure 7. All curves are single peaks, the peak of the curve is unchanged, but the area gradually expands. The micropore area fluctuated slightly (5.7%) during the 4 cycles, while the macropore area increased by 141% with the number of cycles, indicating that the number of macropores is the main factor affecting soil expansion.