заплесневелый
Кривые расширения при разных циклах
Фигура 2 показывает кривую расширения образца почвы под 0-4 сухой и влажный циклы. ЯМР-анализатор Поскольку образец почвы ограничен с боков кольцевым ножом, происходит только вертикальная деформация. Вертикальное расширение - это объемное расширение образца почвы.. Расширение объема увеличивается примерно 20% после первого цикла, а затем постепенно уменьшается по мере увеличения количества циклов. В процессе сушки, радиальная усадка образца грунта больше осевой., что приводит к увеличению высоты образца почвы по сравнению с первоначальной.
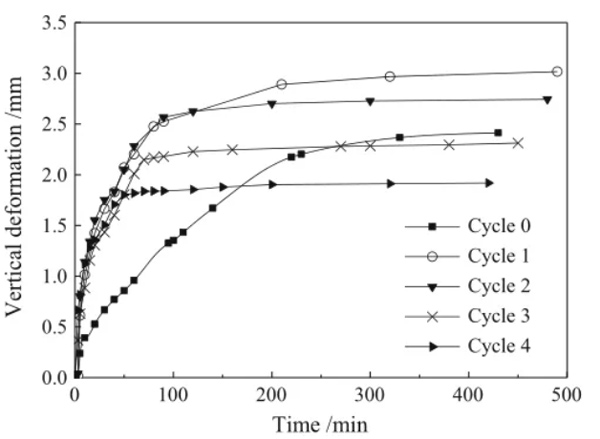
Кривая изменения кривой расширения при разном времени цикла аналогична.: первый быстрый рост, затем медленный рост, и, наконец, стабилизируется. В 0 циклы, нужен образец почвы 230 минут, чтобы добраться 90% деформации расширения, в то время как 1-4 для цикла анализа почвы требуется только 100 минуты.
Учет различных характеристик расширения образцов почвы в разные периоды времени., принимая 3 циклы в качестве примера, кривая разделена на 3 разделы по 0-30мин, 30-90min and> 90min, и каждая секция линейно подогнана, как показано на рисунке 3. Коэффициент корреляции кусочной подгонки выше, и градиенты трех ступеней, в свою очередь, меньше.
Результат ЯМР
Т2 Предельное значение
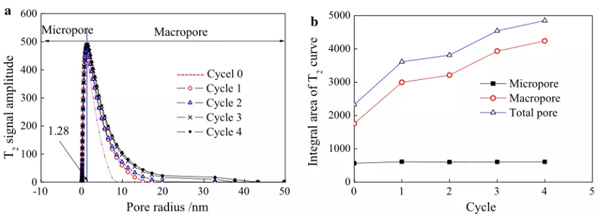
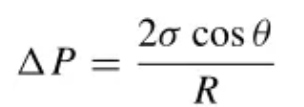
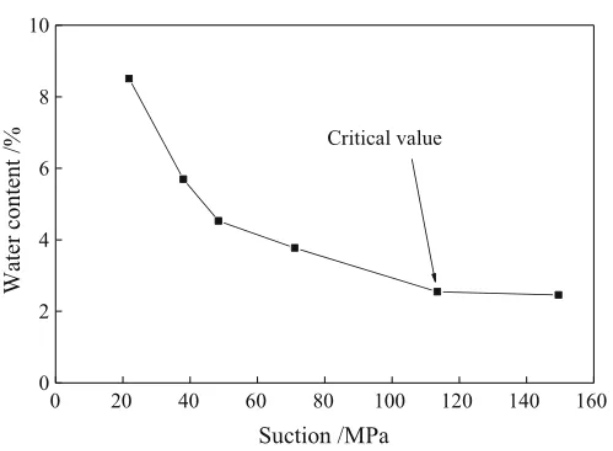
Фигура 4 показывает изменение влажности почвы при разном всасывании. По мере увеличения всасывания, содержание воды постепенно уменьшается. По соответствующей формуле между силой всасывания и диаметром пор, критическая сила всасывания определяется как 113.5 МПа, соответствует диаметру пор 1.28 нм. Сила всасывания, превышающая 113,5 МПа, все еще не может удалить адсорбированную воду в порах размером <1.28нм, и 1,28 нм также является критическим значением, позволяющим отличить макропоры от микропор..
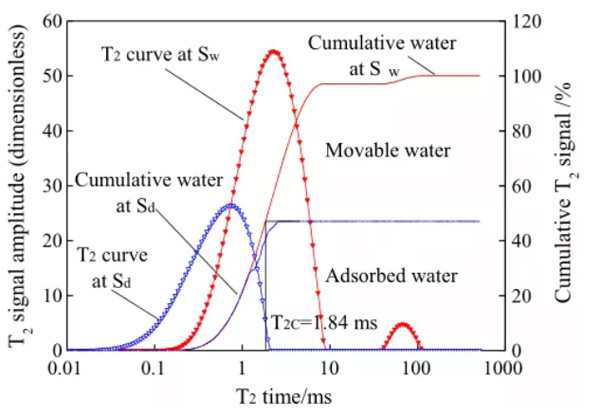
Т2 кривая насыщения и разрежения 113,5 МПа показана на рисунке. 5. Кривая насыщения содержит воду в макропорах и микропорах., в то время как кривая при критическом отсасывании содержит воду только в микропорах. Определить Т2 значение отсечки составляет 1,84 мс, см. рисунок 5 для метода определения. Из расчета Т2 пороговое значение, доля крупных пор 47.1% а для мелких пор 52.9%.
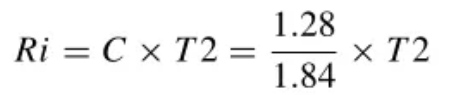
Коэффициент преобразования можно получить через критическую апертуру и T2 пороговое значение, а потом Т2 кривая распределения преобразуется в кривую распределения апертуры:
Т2 кривая распределения при различном содержании воды
Т2 кривая распределения семи образцов с содержанием воды в пределах от 10-28% в этой статье показано на рисунке 6. По методу, указанному в 4.1, Т2 кривая распределения преобразована в кривую распределения пор по размерам.
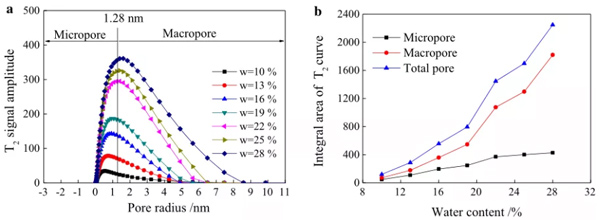
Как показано на рис.. 6 (а), все кривые распределения пор по размерам имеют вид одного пика. Распределение пор по размерам неравномерно; большинство пор распределены между 0,06-8,57 нм и количеством макропор. (1.28-8.57нм) больше микропор (0.06-1.28нм); пик постепенно расширяется вправо.
Как показано на рис.. 6 (б), когда содержание воды увеличивается, увеличивается количество макропор и микропор: когда содержание воды низкое, эти двое близки; когда содержание воды высокое, макропоры увеличиваются более значительно.
Т2 кривая распределения при разном времени цикла
Распределение пор по размерам при различных сухих и влажных циклах показано на рисунке. 7. Все кривые представляют собой одиночные пики, пик кривой не изменился, но территория постепенно расширяется. Площадь микропор слегка колебалась. (5.7%) во время 4 циклы, а площадь макропор увеличилась на 141% с количеством циклов, что указывает на то, что количество макропор является основным фактором, влияющим на расширение почвы..