 NIUMAG
Introduction
Rock is a porous medium with complex pore structure, and it is also the primary research object in the field of oil and gas exploration and development. At present, low-field nuclear magnetic resonance is widely used for core analysis. There are currently two main analytical methods for low-field nuclear magnetic resonance, namely nuclear magnetic resonance relaxation spectroscopy (NMRS) and nuclear magnetic resonance imaging (MRI).
In the relaxation spectrum, the calculation of spectral parameters of one-dimensional T1 and T2 spectra and the analysis of line shape and trend changes are important. Because the collected signals are general hydrogen signals, single relaxation spectrum analysis has problems of averaging effects and signal overlap. Relaxation spectrum analysis has begun to develop toward two-dimensional relaxation spectrum. The two-dimensional relaxation spectrum can effectively distinguish different signal sources with similar signals on the one-dimensional spectrum by adding relaxation physical information.
Nuclear magnetic resonance imaging is used to directly observe the morphological distribution of fluids in rocks and the structural changes of porous media, and to study the laws of percolation and fluid-solid coupling. Currently it is mainly used in the analysis of loose porous media and artificial cores.
Rock physical property test
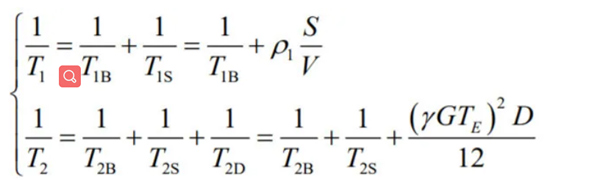
The nuclear magnetic signal directly reflects the scale of the hydrogen-containing fluid in the pores. The relaxation parameters (ie, T1, T2, and D) obtained by the inversion of the attenuation signal are the basis for studying the physical parameters of the rock. NMR porosity is determined by the total amount of NMR signals. The saturation, permeability, and wettability characteristics depend on relaxation parameters and theoretical models, so the latter three are indirectly obtained parameters.
Porosity
The integrated area of the T2 spectrum is proportional to the hydrogen content of the fluid in the core pores. The correlation between the NMR signal and the porosity can be obtained by calibration to obtain the NMR porosity of the rock sample to be measured.
For carbonates, tight sandstones, and shales, nuclear magnetic testing can obtain basically the same results as helium boreholes; but for strong susceptibility rock samples such as igneous rocks, the greater the magnetic susceptibility, the nuclear magnetic porosity and helium boreholes The greater the degree error.
In addition, some scholars have found that the cuttings porosity is basically consistent with the standard core porosity. So, for samples that are difficult to coring, the cores can be used instead of cores to test the porosity.
Fluid saturation
The T2 spectrum reflects the pore size distribution of the reservoir. Constrained by capillary forces and viscous forces, when the pore radius is small to a certain degree, the fluid will be trapped in the pores and cannot flow. This pore diameter will correspond to a critical value in the T2 spectrum. When the fluid relaxation time is greater than the critical value of T2, the fluid is regarded as a movable fluid, otherwise it is an immovable fluid. Therefore, this critical value is also called the movable fluid T2 cutoff value (T2cutoff). The T2 cutoff value is an important parameter for calculating the saturation of the irreducible fluid and is used to evaluate the availability of reservoir fluid.
Permeability
There are two main methods of classical nuclear magnetic permeability estimation, namely the Coates model that depends on fluid saturation and the SDR model that depends on pore size. Both the Coates model and the SDR model consider the effect of pore size distribution on permeability, but the Coates model believes that permeability is only a two-stage contribution of movable fluids and bound fluids, while the SDR model simply averages the pore size distribution. For conventional reservoir cores with simple pore structures, the two methods are ideal for characterizing permeability.
For reservoirs (carbonate, shale) with large pore spans, due to the large difference in the contribution of pores of different sizes to permeability, the model needs to be modified and improved. Therefore, the current calculation models and methods cut-off value and the direction of the multi-porosity contribution are developing.
By analyzing the correlation between permeability and parameters such as porosity, pore size distribution, and movable / bound fluid saturation, the factors affecting reservoir permeability and their respective weights can be clarified to obtain a more complete and accurate nuclear magnetic permeability prediction model.
Wettability
Different from the conventional wetting angle measurement to quantitatively characterize the wettability of rock samples, the nuclear magnetic wettability characterization is based on fluid saturation test, which needs to combine different fluid saturation and centrifugation experiments to compare the shape and evolution trend of relaxation spectrum lines before and after the experiment Or, the change history of fluid saturation can be obtained through the calculation of cut-off value, which more qualitatively illustrates the core wetting.
In order to quantitatively characterize the wettability of the core, the calculation equation of the NMR wettability index (Iw) is given in the literature:
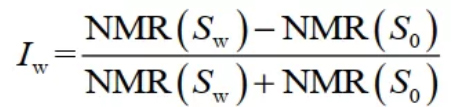
Among them, Iw ranges from -1 to 1, where -1 represents strong oil wetness, 0 represents no significant wetting preference, and 1 represents strong water wetness.
Due to the obvious differences in the mineral composition and content of different types and regions of reservoirs, it is difficult to evaluate the wettability of complex cores. Therefore, the wettability characterization has also evolved from a single factor and a single method to a multi-factor comprehensive analysis.
Pore structure characterization
The mercury intrusion method and the CO2 / N2 adsorption method are traditional and widely used core pore size distribution testing methods.
The mercury intrusion method reflects the pore size and pore throat distribution through the external pressure. However, under high pressure conditions, the microstructure of the rock will be destroyed, and some pore data will be distorted. Therefore, the test range mainly includes large pores and some mesopores in the sample.
Although the gas adsorption method has perfected the characterization of the micropore-mesopore (2-50nm) distribution, it has limited monitoring scope for the macropores (greater than 100nm). It is the same as the mercury intrusion method which is a destructive test for invading cores.
The T2 spectrum measured by low-field nuclear magnetic resonance reflects the entire pore information of the rock sample, while ensuring that the sample is not damaged, so it is more and more widely used.
- The correspondence between the typical T2 spectrum and the aperture r is as follows:
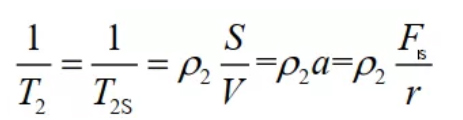
As can be seen from the above formula, the T2 distribution reflects the pore size information. Specifically, the higher the peak of the spectral line and the narrower the distribution, the larger the proportion of pores corresponding to the peak and the more uniform the pore distribution. According to the shape and trend of the relaxation spectrum line, a bimodal or multimodal model can be inverted and used to calculate the contribution of relaxation in small and large pores to the total relaxation, and to study the connectivity of the pore network.
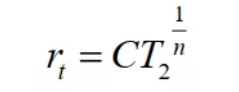
- Although the surface relaxation rates of rock samples in similar regions or the same horizon can be approximately equal, the values of surface relaxation rate and shape factor are generally not universal. The T2 distribution can be transformed into the pore radius distribution by combining the mercury intrusion curve, and the conversion coefficient C value can be determined according to the similar characteristics of the mercury intrusion curve and the T2 curve:
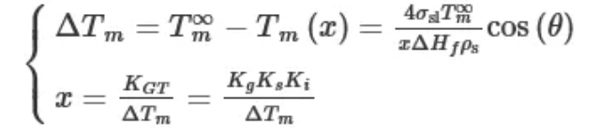
- Nuclear magnetic resonance nanopore analysis method uses the signal difference calculation before and after the solidification of the saturated fluid to obtain the pore size, which avoids the measurement of the surface relaxation intensity and the influence of paramagnetic substances on the nuclear magnetic signal. However, this method has higher requirements for the properties of saturated liquids.
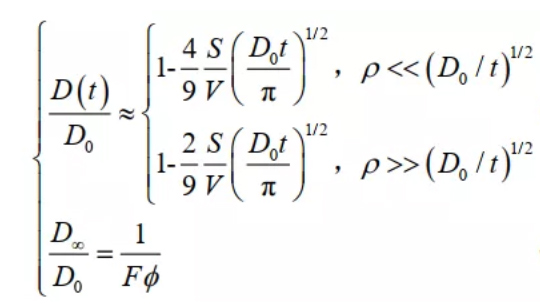
- According to the characteristics of the free diffusion of hydrogen protons, using the hydrogen nucleus diffusion coefficient as a variable can be used to study the geometric morphology and connectivity characteristics of rock pores, but this method cannot describe the complex pore shape and hydrogen nucleus diffusion process in the pore network. Can give the pore size and connectivity in extreme conditions:
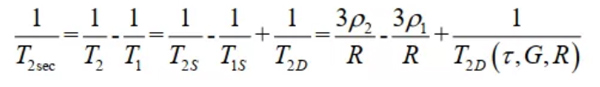
- Combining the two-dimensional relaxation model of T1, T2, and diffusion coefficient D, it is possible to observe that the porous media with different pore sizes have significantly different signal distributions on the T1-T2 or D-T2 spectrum:
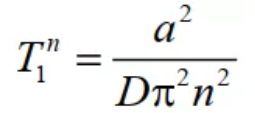
- Due to the difficulty in obtaining an accurate surface relaxation rate ρ, the relationship between the relaxation information and the pore feature size of the DDIF sequence through the internal field excitation to obtain a high characteristic state (n≥1):
Regardless of whether to obtain the pore size distribution or characterize the shape and connectivity of the pores, hydrogen nucleus probes in the water that fill the pores need to “touch” the pore wall. The results are controlled by the hydrogen nucleation relaxation behavior, so the relaxation time is used to calculate the pore structure correlation. The parameters also have strict requirements on sample pore size and connectivity.
Pore fluid identification
Pore fluid identification is the most basic application of two-dimensional nuclear magnetic resonance technology in the field of core analysis. Due to the obvious differences in the diffusion coefficients of oil, gas, and water, the two-dimensional distribution of D-T2 can distinguish these three common fluids in rocks, making up for the short board of overlapping signals in the one-dimensional T2 spectrum. The D-T2 spectral distribution will vary depending on the composition of the rock sample and the type of fluid, so it is possible to estimate fluid viscosity and quantify oil and gas saturation based on the separation of multiphase fluid signals.
When the molecular weight of the hydrogen-containing fluid in the rock pore is greatly different, the T1 / T2 ratio will also be very different. Therefore, in addition to the D-T2 spectrum, the T1-T2 spectrum can also be used to distinguish the fluid from other components in the pore.
Other studies combined with MRI
Based on core immersion, displacement, centrifugation, and dry-wet cycle experiments, combined with NMR spectral lines and imaging technology, it can directly or indirectly reflect changes in fluid distribution in porous media, and further analyze changes in pore structure. Research on various phenomena in the regulation of energy development and production.
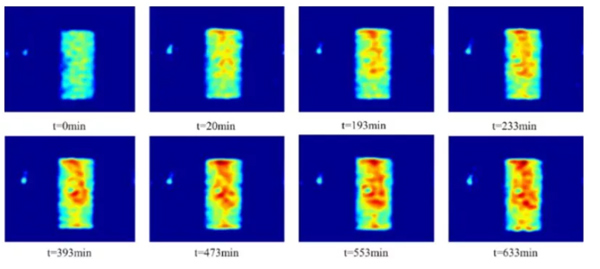
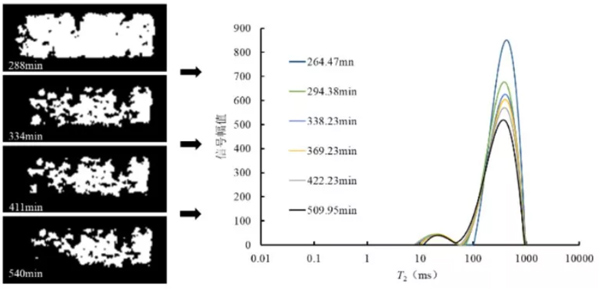
The first type of application studies the morphological distribution characteristics and migration laws of fluids by changing the spatial distribution of nuclear magnetic signals before and after displacement. This type of application is represented by nuclear magnetic resonance technology research on enhanced oil recovery, CO2 flooding of coalbed methane, hydrate synthesis and decomposition, etc. It is mainly described qualitatively and provides objective support for theoretical analysis.
The nuclear magnetic signal of the hydrogen-containing and non-hydrogen-containing liquid displacement media has a strong difference, and the imaging observation effect is good; while the signal strength of the hydrogen-containing gas displacement medium is weaker than that of the liquid, and it is more likely to be lost due to noise in real rock samples. Observation time is longer. Figure 1 shows the coal methane adsorption process; Figure 2 shows the natural gas hydrate formation process.
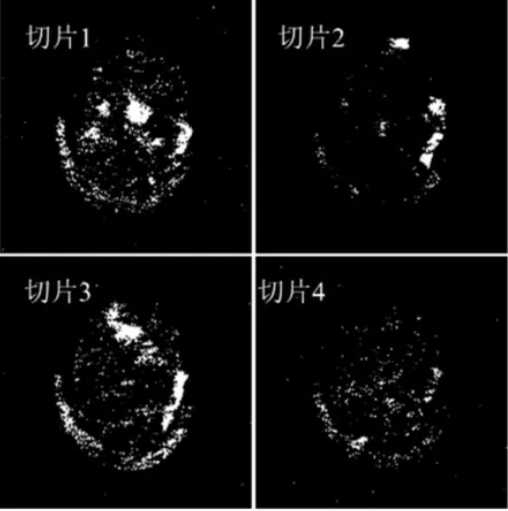
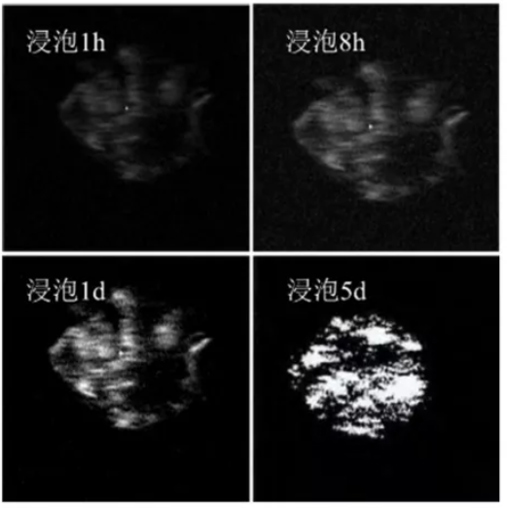
Rock damage experimental imaging observations are based on the bright spots and brightness of the image to intuitively and qualitatively understand and describe the evolution of pore evolution and micro-cracks in the rock, such as the freeze-thaw damage of granite and the hydration damage of shale. Shown in Figure 4. Similar studies can be performed with the help of CT scans and digital core reconstruction.
Conclusion
After more than 60 years of development, NMR technology suitable for the study of rock porous media has been quite mature, and because of its non-destructive testing characteristics, it has been more and more widely used in the field of mining.
This article summarizes the application results of nuclear magnetic resonance technology in petrophysical testing and structural characterization, summarizes the existing problems and technical bottlenecks in the application, and summarizes the development trend of the technology: (1) improving and developing the relaxation of porous rock media Theory, (2) enrich detection objects, (3) improve signal-to-noise ratio, (4) optimize experimental parameters and steps, and improve inversion algorithm.
Among them, rich detection objects include obtaining more physical quantities containing relaxation information through sequence development and using different fluid media as nuclear magnetic signal carriers. At the same time, it is necessary to deepen the understanding of various types of reservoirs, complement each other, and combine various analytical calculation methods and experimental methods to assist and verify the results of nuclear magnetic experiments.