 заплесневелый
Полученные результаты
The Настольный ЯМР Т2 spectrum distribution curve of the carbon dioxide miscible flooding process is shown in Figure 5. Under the same parameter, the signal intensity is positively related to the number of protons or molecules. The signal intensity reflects the amount of n-dodecane in the sample. Because n-dodecane was replaced by carbon dioxide, Т2 spectrum distribution curve decreased during the carbon dioxide miscible flooding. Т2 spectrum distribution curve of shale has two peaks, while the T2 spectrum distribution curve of sandstone has only one peak. The hydrocarbons in shale are divided into bitumen, organic matter restraint oil, organic matter free oil and movable oil.
In the NMR T2 распределение, the transition interface between shale organic matter fettered oil and organic matter free oil is about 3-10 РС, and shale organic matter fettered oil contains adsorbed and absorbed hydrocarbons. Поэтому, bitumen and organic matter combined oils are classified as fixed oils, and other oils are classified as free oils. Figures 5b and c show that the boundary between the fixed oil and the free oil of the shale in the NMR T2 distribution is 3 РС. Кроме того, Т2 of sandstone free oil peak (100РС) is larger than that of shale (11РС), indicating that the average pore size of sandstone is larger than that of shale. From the T2 spectrum distribution curve at 0h, the proportion of fixed oil can be obtained. The fixed oil porosity of shale is lower than the free oil porosity.
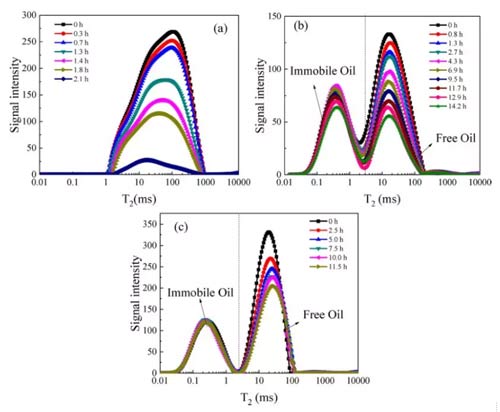
Fig.5 T2 spectrum distribution of CO2 miscible flooding (а) sandstone; (б) (с) сланец
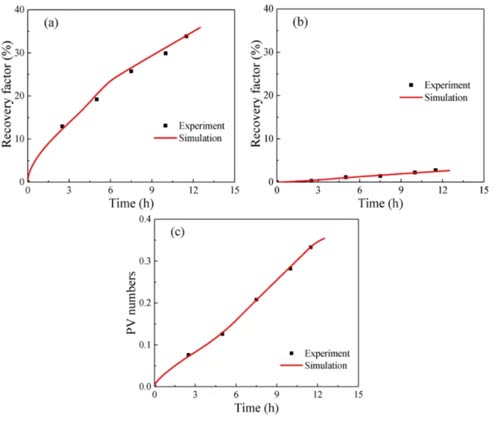
The amplitude of the NMR signal is directly proportional to the number of hydrogen nuclei and positively related to the oil content of the porous medium. Поэтому, the recovery of fixed oil and free oil during the CO2 miscible flooding process can be obtained according to the area changes of different peaks in FIG. 5, as shown in FIG. 6.
When injecting 1.69PV (PV: initial total pore volume) into the sandstone, the oil recovery increased to 90% in 2.1h, as shown in Figure 6a, indicating that a small amount of carbon dioxide injection into the sandstone can drive almost all Of oil. Both the growth rate of the free oil recovery curve and the PV number curve increase with time. There are two reasons for this phenomenon: the viscosity of the carbon dioxide-n-dodecane mixture decreases with the injection of carbon dioxide; at the same time, the carbon dioxide and oil The diffusion coefficient increases with carbon dioxide injection. Как результат, both the flow velocity and diffusion of the fluid in the sample increase over time.
Figure 6b shows that shale 1 was injected with 4.95PV of carbon dioxide for 14.23h, and the recovery ratios of free oil and fixed oil were 65.8% и 19.0%; The recovery of fixed oil is 33.8% и 2.7%, соответственно. Because carbon dioxide rarely replaces the adsorption and absorption of oil in organic matter, the recovery of fixed oil is much lower than that of free oil. The recovery rate of free oil initially increased rapidly, and then the growth rate suddenly decreased. This is due to the heterogeneity of shale. В первые дни, clay-organic matter and inclusions contributed significantly to the recovery of free oil; after the carbon dioxide breakthrough, the recovery of free oil in clay-organic matter decreased; after that, the recovery rate and PV number slowly increased with time.
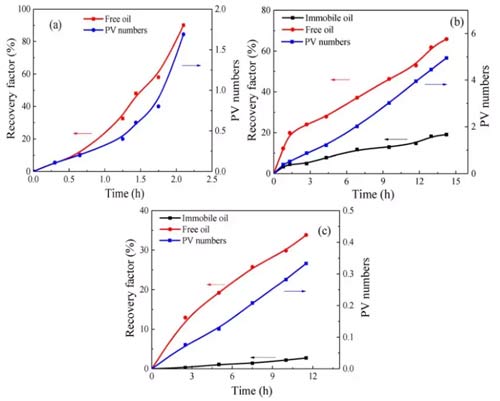
Compared with sandstone, the longer the CO2 injection time of shale, the smaller the recovery factor. This phenomenon has two reasons: (а) it is more difficult for carbon dioxide to replace fixed oil in shale; (б) the heterogeneity of shale is stronger than that of sandstone. Some of the oil in shale cannot be replaced by carbon dioxide.
Обсуждение
The heterogeneity of shale and the replacement of carbon dioxide for organic matter adsorption and oil adsorption are the main differences between shale and sandstone during the CO2 miscible flooding process. Однако, the above differences are difficult to obtain experimentally, so the effects of heterogeneity and competitive adsorption of shale on the miscibility of carbon dioxide in shale are simulated by numerical models.
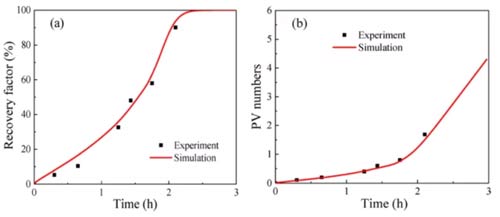
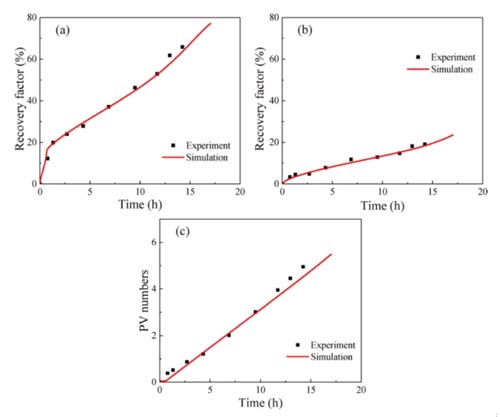
According to this model, the proportion of inclusions in the shale (р0), the permeability of the inclusions (kh), and the permeability of the clay-organic matter (kl) are three heterogeneity parameters. The adsorption absorption rate (kads) and the CO2 displacement oil threshold (ω0) in organic matter are two parameters for the mixture to compete for adsorption. These five parameters must be estimated by fitting the experimental results, and other parameters in the model can be obtained through experiments. Figures 7-9 show that the numerical simulation results are in good agreement with the experimental data.
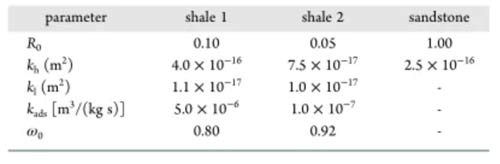
The parameter estimation results of different samples are shown in Table 3. The proportion of shale inclusions is low for two reasons: первый, the content of organic matter and clay in shale is high; второй, the density of organic matter and clay is much lower than other minerals. The permeability of both shale sample inclusions is higher than the clay-organic matter permeability. The clay-organic matter permeability is similar, but the permeability of the inclusions is different, which may be due to sedimentation. The kads of shale 1 are higher than those of shale 2, and ω0 is lower than that of shale 2, both of which are favorable for the adsorption and absorption of carbon dioxide, resulting in a fixed oil recovery of shale 1 higher than that of shale 2.
Стол 3 Parameter estimation results for different samples
Parameter sensitivity analysis
Effects of inclusion ratio (р0), inclusion permeability (kh), clay-organic matter permeability (kl), adsorption and absorption rate (kads), and carbon dioxide replacement oil threshold (ω0) in organic matter on carbon dioxide miscibility flooding in shale A system sensitivity analysis was performed. The recovery factor is in good agreement with the experimental results, and the difference between free oil and fixed oil is obvious.
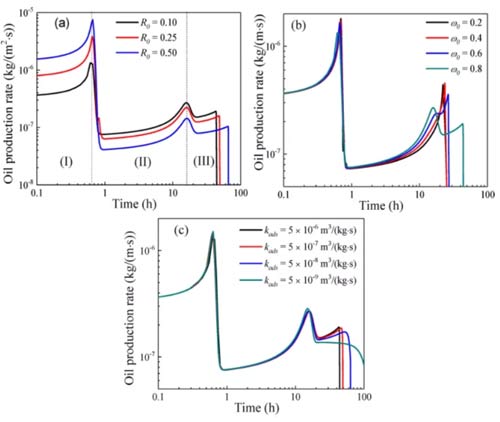
The miscible flooding process of carbon dioxide in shale can be divided into three stages. In the first stage, the oil in the inclusions is replaced by carbon dioxide, and the oil production rate is high. When CO2breaks through the inclusions, the oil production rate decreases. In the second stage, the free oil in the organic matter-clay is replaced by carbon dioxide. When the mass fraction of carbon dioxide is greater than ω0, the adsorption and absorption oils in the organic matter are replaced by carbon dioxide. With the increase of the amount of carbon dioxide injection, the carbon dioxide broke into the organic matter-clay, and the oil production rate decreased. Because the permeability of the organic matter-clay is lower than the permeability of the inclusions, the decrease in the oil production rate in the second stage is smaller than that in the first stage. In the third stage, the adsorbed and absorbed oil in the organic matter is replaced by carbon dioxide. Кроме того, as the flow and diffusion of fluids increase as the mass fraction of carbon dioxide increases, the oil production rate in each stage increases over time.
As shown in Figure 10a, the oil production rate in the first stage increases with R0, and the oil production rate in the second and third stages decreases with R0, because the free oil in the inclusions increases with R0, and the oil in the organic matter-clay Decreases with R0.
Как показано на рис.. 10б, the influence of ω0 on the oil production rate can be ignored in the first stage. The duration of the second stage decreases with increasing ω0, because the concentration of free oil in organic matter-clay increases with decreasing ω0. The duration of the third stage increases with the increase of ω0, because the smaller ω0, the easier it is for the adsorbed and absorbed oil in the organic matter to enter the free phase and be replaced.
As shown in Figure 10c, the impact of kads on the first and second stages of oil production is minimal.
The results show that most of the adsorbed and absorbed oil in the organic matter is not replaced in the first and second stages; in the third stage, the oil production time decreases with the increase of kads, and the oil production time is also affected by the oil adsorption and adsorption in the organic matter Mobility control of oil.
Заключение
В этой статье, a coupling experiment of NMR and mathematical models was performed for carbon dioxide miscible flooding in shale and sandstone. The main conclusions are as follows:
(1) On the NMR- Т2 spectrum distribution curve, shale oil is divided into fixed oil and free oil at 3ms. The shale samples have lower fixed oil porosity than free oil.
(2) Due to immobility of fixed oil and heterogeneity of shale, the recovery and oil production rates of sandstone in the CO2 miscible flooding process are higher than those of shale.
(3) The carbon dioxide miscible flooding process in shale can be divided into three stages: the oil in the inclusions is replaced by carbon dioxide; the free oil in the organic matter-clay is replaced by carbon dioxide; the adsorbed and absorbed oil in the organic matter is replaced by carbon dioxide.
(4) Sensitivity analysis of three physical parameters (р0, ω0, and kads) shows that the oil production rate in the first stage increases with the increase of R0, which is opposite to the second and third stages. The duration of the second phase decreases as ω0 increases. The duration of the third stage increases with increasing ω0 and decreases with increasing kads.