 NIUMAG
Introduction
China’s Xinjiang glutenite reservoir is rich in reserves. However, the glutenite reservoir has the characteristics of strong heterogeneity, complex pore throat structure and wide pore size distribution. Quantitative analysis of the full-scale pore structure and movable oil distribution of glutenite is very important.
Nuclear magnetic resonance (NMR) is a fast, non-destructive method for pore measurement. It obtains information on rock physical properties and fluid occurrence state (porosity, permeability, pore size distribution, proportion of movable fluid, etc.) by testing the nuclear magnetic resonance T2 spectrum of saturated hydrogen-containing fluid cores. The key to characterizing the full-scale pore size distribution is to determine the conversion coefficient C between the transverse relaxation time T2 and the aperture r.
The acquisition method of the conversion coefficient C value has an empirical method, a T2 cutoff value method, and a similarity method. The empirical method is only applicable to reservoirs with specific homogeneity; the T2 cutoff method is only applicable to reservoirs with good pore connectivity; the similarity method is currently the most commonly used method for low permeability and tight reservoirs, where T2 spectrum The combination with the high pressure mercury flow pore size distribution curve is most common. However, the permeability of glutenite is relatively low, and the saturation of mercury injection is usually less than 50%. The method of determining the C value by nuclear magnetic combined with high pressure mercury is not applicable to glutenite.
In this paper, a method for determining C value by low temperature nitrogen adsorption combined with nuclear magnetic resonance is proposed. Low temperature nitrogen adsorption can characterize the pore throat distribution, and the minimum identifiable pore size depends on the set minimum relative pressure. The smallest pore that can be characterized by NMR Analyzer depends on the atomic size of the saturated fluid and the TE value of the NMR parameter. When a suitable saturated fluid and appropriate parameters are selected, the pore size distribution obtained by low temperature nitrogen adsorption and the nuclear magnetic resonance T2 spectrum will have good similarity in the range of <200 nm.
Principle
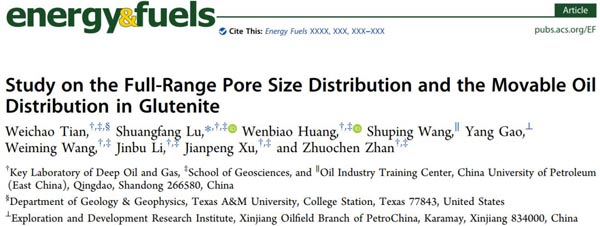
In this paper, 18 samples from the glutenite reservoir of Xinjiang Oilfield were prepared (Table 1). Each group of samples was divided into six parts, which were subjected to X-ray diffraction (XRD), cast thin sections, scanning electron microscopy (SEM), and low temperature Nitrogen adsorption (LTNA), high pressure mercury (HPMI) and NMR tests were carried out, wherein the NMR test was carried out by a Meso MR23-060H-I NMR apparatus manufactured by Niumag.
Table 1 Lithology and main mineral content of glutenite samples
Results
Mineral composition and sedimentary composition characteristics
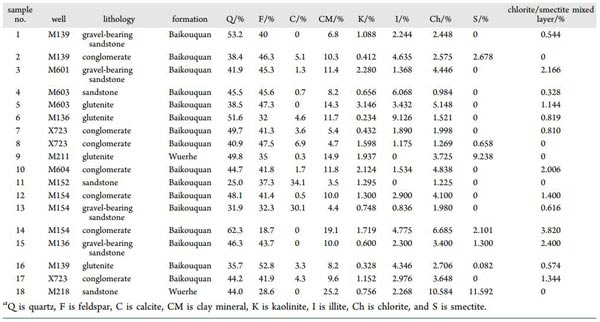
The glutenite is dominated by quartz (44.3%) and feldspar (40.1%), followed by clay minerals (10.3%), as shown in Table 1. The analysis of the cast flakes revealed that the glutenite sedimentary debris particles were dominated by rock debris (58.2%), followed by feldspar debris (15.9%) and quartz debris (12.3%). The particle sorting is medium to poor, and the roundness is mainly near circular and nearly angular. The more quartz and feldspar debris, the more micron-sized pores develop; the more volcanic rock debris, shale matrix and cement, the less developed micron-sized pores.
Reservoir space characteristics
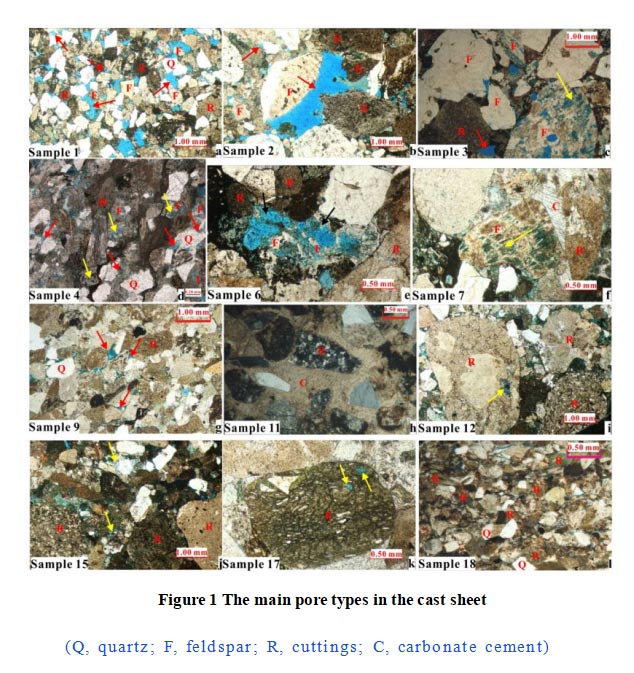
Combined with cast thin sections and scanning electron microscopy (see Figure 2), there are five types of glutenite reservoir space: primary intergranular pores, intergranular dissolved pores, mold pores, intragranular dissolved pores and intercrystalline pores.
The size of primary intergranular pores, intergranular dissolved pores and casting pores is relatively large, ranging from tens to hundreds of nanometers; the pore size of intragranular pores is wide, ranging from tens of nanometers to tens of micrometers; Small, mainly distributed in a few nanometers to tens of nanometers.
Low temperature nitrogen adsorption
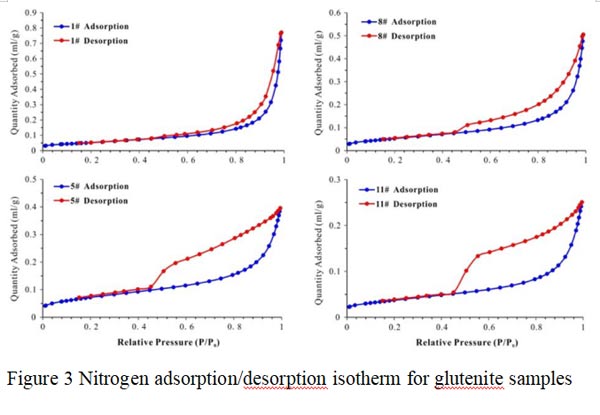
The nitrogen adsorption/desorption isotherm of glutenite has obvious hysteresis loop, and the hysteresis loop type can reflect the pore morphology of porous media. The hysteresis loops of glutenite samples are roughly classified into four types (see Figure 3): Samples 1#, 8#, 5#, and 11# correspond to slits, slit holes, ink bottle holes, and narrow neck wide body ink bottle holes,respectively.
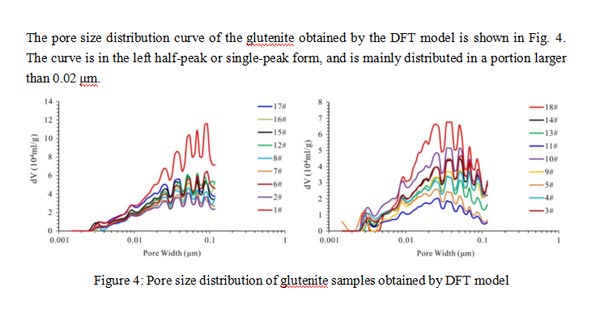
The pore size distribution curve of the glutenite obtained by the DFT model is shown in Fig. 4. The curve is in the left half-peak or single-peak form, and is mainly distributed in a portion larger than 0.02 μm.
NMR T2 spectrum
The NMR T2 spectra of the samples in three states were tested: (1) washing oil and drying at 110 ° C; (2) n-dodecane saturated-So; (3) n-dodecane centrifugation – Soir. The T2 spectrum of the washed oil dry sample represents the bound water of the rock particle surface and the tightly bound hydroxyl water between the clay layers. The T2 spectrum in the So and Soir states needs to subtract the T2 spectrum of the dried sample.
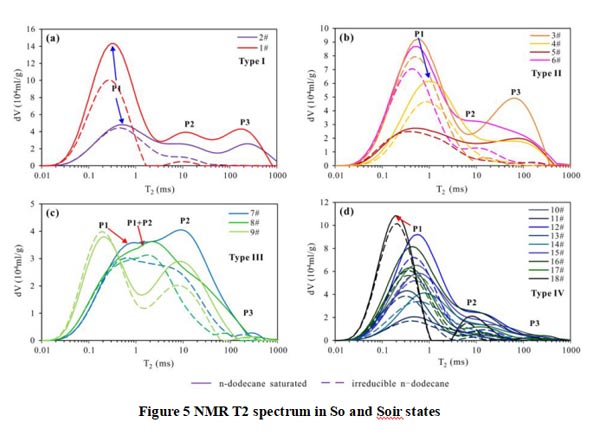
The NMR T2 spectrum of the sample in the So state is shown by the solid line in FIG. The T2 spectrum has a three-peak structure as a whole. There are four types: Type I has three consecutive peaks, P1 peak is the highest, P2 is close to P3; Type II has obvious P1 and P3 peaks, P3 peak shifts to the left; Type III has obvious P1. And P2 peak or P1+P2 peak; type IV P1 peak amplitude is the highest, P2 and P3 peaks are small.
The Soir state is obtained by centrifuging a sample in a saturated oil state to a movable oil. It was calculated by calculation that the residual oil herein was present in pores of less than 0.014 μm or in pores controlled by a throat of less than 0.014 μm. The sample T2 spectrum in the Soir state is shown by the dashed line in Fig. 5, and most of the samples have two peaks (P1 and P2).
The T2 cutoff is determined by the T2 spectrum in the So and Soir states, see Figure 6. The T2 cutoff for the 18 experimental samples varied from 0.438 to 12.993 ms, significantly lower than conventional sandstone and carbonate rocks. The change in the T2 cutoff value is mainly affected by lithology, wettability, ferromagnetic composition and pore throat structure.
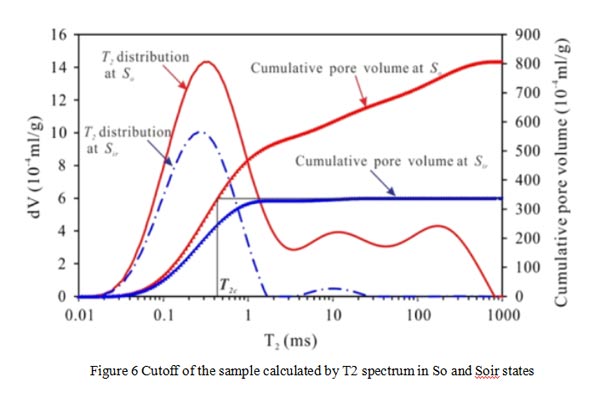
By comparing the T2 spectra in the So and Soir states, we can quantitatively evaluate the shale conglomerate movable oil saturation (Smo). When the sample changes from type I to type IV, Smo exhibits a decreasing trend (47.49-25.01%).