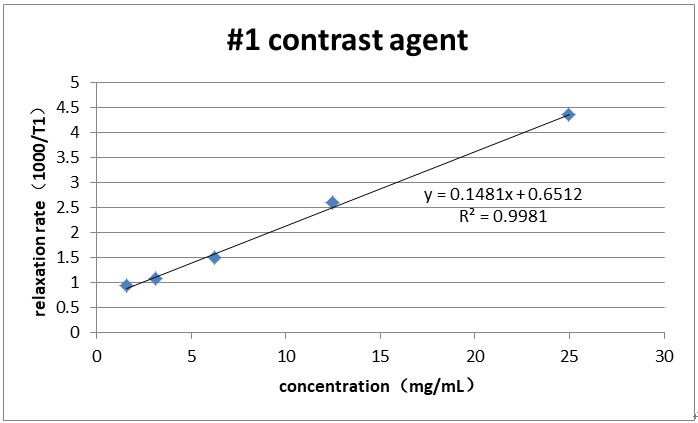
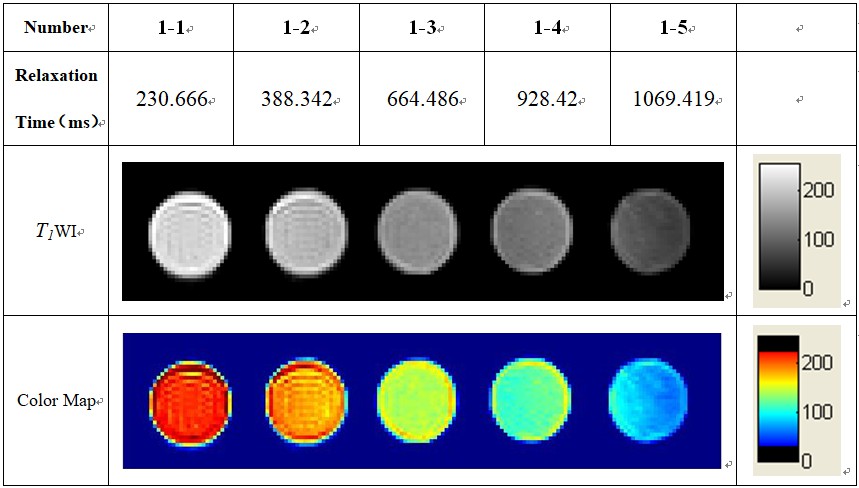
Время релаксации Т1 и взвешенная визуализация Т1 контрастного вещества для МРТ
T1 relaxation time measurement:NMI20 Nuclear Magnetic Resonance, niumag corporation, resonant frequency: 21.170МГц
T1 weighted image:NMI20 Nuclear Magnetic Resonance, niumag corporation, resonant frequency: 21.170МГц
MRI contrast agent Sample preparation
Preparate two contrast agents #1 as 25mg/ml、12.5mg/ml、6.25mg/ml、3.125mg/ml and 1.563mg/ml, соответственно. The samples numbered as Table 1.Then the samples detected in the 25mm coil.
Стол 1 Sample Number
T1 Relaxation Time and Relaxavity
Through measuring the Longitudinal Relaxation Time by inversion recovery pulse sequence(IR) to obtain the recovery time(т) and corresponding amplitude value M(т) of the original data. Then fitting t-M(т) curve with sigle-index model M(т)=М(0)(1-2е(-t/T1)) to obtain the Longitudinal Relaxation Time.
T1 Weighted MRI
T1 weighted image repressed the long relaxation signal and heighten the short relaxation signal, so the shorter the relaxation time is the lighter(deeper of red) the spots are in the picture(color map).
Related product:Устройство визуализации с контрастным веществом для МРТ & Анализатор
 заплесневелый


