Introduction
Long-term freezing will cause damage and deterioration of porous rocks, stone relics and concrete buildings in cold regions. The freezing of pore water is the cause of freezing damage. In the past, researches on pore water freezing process mostly adopted indirect method, which generally analyzed the pore water freezing process indirectly by measuring the changes of rock temperature, deformation, resistivity, P wave velocity and other parameters. The determination of these indirect parameters is susceptible to other factors, such as rock resistivity, which is strongly influenced by liquid water content, rock temperature and mineral composition, and requires additional calibration.
NMR Analyzer method is a good choice for this research. Since the relaxation signal of ice is much smaller than that of unfrozen water, the change of T2 value during freezing process can describe the freezing process of pore water intuitively and accurately. In addition, pore water components can be inferred from T2 spectrum and detailed pore water freezing mode information can be obtained through the changes of each component during freezing process. The method has been used to estimate the pore structure of rock and soil materials, test the content of frozen water and evaluate the rock freezing damage.
In this study, the freezing process of pore water in 9 sandstone samples with different initial moisture content was studied by using low field nuclear magnetic resonance (LFMR) method and high resolution temperature test. The freezing process of pore water was characterized by measuring unfrozen water content, T2 spectrum and rock temperature. Accordingly, the potential influence of pore water freezing mode and initial water cut on sandstone is analyzed.
Principle
In low field NMR, the ice NMR signal (FID) is very weak. Therefore, the free attenuation signal of unfrozen water can be used to test the content of unfrozen water in frozen rock, and the calculation formula is as follows:

Sw is the unfrozen water content of the sample. FIDfrozen is FID value of corrected sample at -20℃; FIDsaturated represents FID value of saturated water samples at room temperature.
According to the occurrence of pore water in porous rock, pore water can be divided into bound water, capillary water and free water. Bound water mainly refers to mineral surface adsorbed water and clay mineral interlayer water. The T2 spectrum of pore water in a uniform magnetic field at a constant temperature is dominated by surface relaxation, which mainly depends on the properties of the liquid and its affinity to the mineral surface and inner surface. Therefore, pore water components can be inferred from T2 spectrum: T2 value < 3ms in sandstone corresponds to bound water, 3 to 33ms corresponds to capillary water, and > 33ms corresponds to free water.
Experiment
The sandstone in this paper is a tight fine-grained sandstone. Disk-shaped samples (50mm in diameter and 25mm in height) were drilled from fresh unweathered large blocks of sandstone, and 9 samples with similar p-wave velocity were selected. The properties of the sample are shown in the table below.
Table 1 sample physical parameters

The saturation degree of the sample is the ratio between the current water content and the water content under the condition of full saturation, as shown below:

Where, St is the saturation degree of the sample at time t;Mt is the mass at the moment t of the sample. Ms and md were the mass of the sample after full saturation and dehydration, respectively.
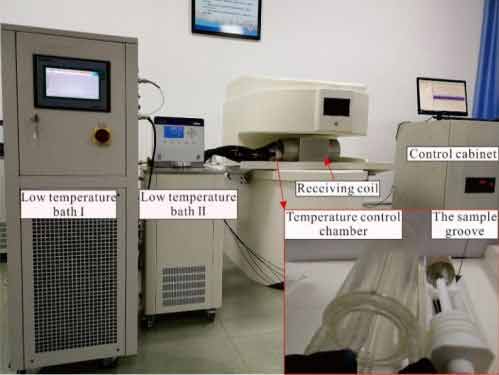
The NMR equipment adopts MacroMR12-150H NMR analyzer produced by Suzhou Niumag analytical instrument co., LTD. The environment chamber, which provides uniform and three-dimensional freeze-thaw conditions, is integrated with the coil, and the temperature change inside the coil is automatically controlled by the computer, so as to monitor the changes of pore water phase composition in the freeze-thaw process in real time. Air temperature and rock surface temperature in the tank are measured by optical fiber, as shown in the figure below.

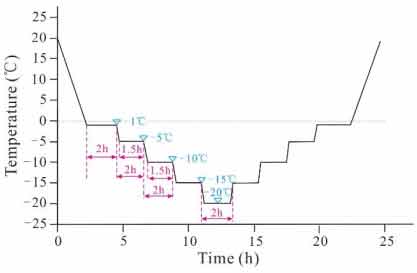
The temperature variation setting in freezing-thawing process is shown in figure 2

 NIUMAG